2010 Rhode Island Kids Count Factbook
2010 Rhode Island Kids Count Factbook
2010 Rhode Island Kids Count Factbook

Create successful ePaper yourself
Turn your PDF publications into a flip-book with our unique Google optimized e-Paper software.
Table 42.<br />
Student Mobility and Stability Rates by District, <strong>Rhode</strong> <strong>Island</strong>, 2008-2009 School Year<br />
ENROLLMENT ENROLLED ENROLLED EXITED<br />
FOR 2008- THE WHOLE AFTER AFTER STABILITY MOBILITY<br />
SCHOOL DISTRICT 2009 YEAR OCT. 1 OCT. 1 RATE RATE<br />
Barrington 3,506 3,398 53 56 97% 3%<br />
Bristol Warren 3,649 3,350 138 175 92% 9%<br />
Burrilville 2,740 2,466 115 182 90% 11%<br />
Central Falls 3,727 2,803 428 564 75% 27%<br />
Chariho 3,836 3,503 160 194 91% 9%<br />
Coventry 5,740 5,271 183 312 92% 9%<br />
Cranston 11,433 10,195 632 702 89% 12%<br />
Cumberland 5,249 4,871 166 224 93% 7%<br />
East Greenwich 2,474 2,345 75 60 95% 5%<br />
East Providence 6,220 5,518 291 451 89% 12%<br />
Exeter-West Greenwich 2,009 1,879 76 64 94% 7%<br />
Foster 261 247 13 1 95% 5%<br />
Foster-Glocester 1,518 1,393 24 105 92% 8%<br />
Glocester 658 617 23 20 94% 7%<br />
Jamestown 505 468 20 19 93% 8%<br />
Johnston 3,447 2,983 199 301 87% 15%<br />
Lincoln 3,392 3,247 143 4 96% 4%<br />
Little Compton 313 307 2 4 98% 2%<br />
Middletown 2,604 2,211 187 229 85% 16%<br />
Narragansett 1,530 1,420 68 54 93% 8%<br />
New Shoreham 145 119 12 14 82% 18%<br />
Newport 2,326 1,896 202 258 82% 20%<br />
North Kingstown 4,649 4,309 159 206 93% 8%<br />
North Providence 3,265 3,105 141 21 95% 5%<br />
North Smithfield 1,958 1,821 78 82 93% 8%<br />
Pawtucket 10,016 7,764 971 1,463 78% 24%<br />
Portsmouth 3,060 2,761 149 184 90% 11%<br />
Providence 28,237 21,000 3,095 4,768 74% 28%<br />
Scituate 1,742 1,671 27 44 96% 4%<br />
Smithfield 2,638 2,491 85 73 94% 6%<br />
South Kingstown 3,959 3,546 144 292 90% 11%<br />
Tiverton 2,078 1,828 127 135 88% 13%<br />
Warwick 11,475 10,244 532 774 89% 11%<br />
West Warwick 4,265 3,315 342 675 78% 24%<br />
Westerly 3,398 3,067 162 193 90% 10%<br />
Woonsocket 6,804 5,420 616 917 80% 23%<br />
CUMULATIVE # # #<br />
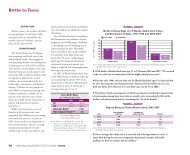
School Mobility<br />
and Stability Rates<br />
◆ Mobility rates are calculated by adding<br />
all children who entered any school<br />
within the school district to all those who<br />
withdrew from any school in the district<br />
and dividing the total by the total<br />
enrollment for that school district. 15<br />
◆ Stability rates measure the number of<br />
children who attended the same school<br />
the entire school year in a school district.<br />
The stability rate is calculated by dividing<br />
the number of children enrolled the<br />
whole year at the same school in the<br />
school district by total enrollment for that<br />
school district. 16<br />
◆ Total enrollment for each district is<br />
cumulative over the course of the school<br />
year. 17<br />
◆ The overall <strong>Rhode</strong> <strong>Island</strong> student<br />
mobility rate was 16% in the 2008-2009<br />
school year. The core cities had a<br />
significantly higher mobility rate (26%)<br />
than districts in the remainder of the<br />
state (9%). 18<br />
◆ The average length of time between<br />
enrollments for mobile students in <strong>Rhode</strong><br />
<strong>Island</strong> during the 2007-2008 school year<br />
Charter Schools 2,079 1,930 29 120 93% 7%<br />
State-Operated Schools 2,110 1,450 402 423 69% 39%<br />
UCAP 160 123 19 22 77% 26%<br />
Core Cities 55,375 42,198 5,654 8,645 76% 26%<br />
Remainder of State 99,451 90,651 4,184 5,175 91% 9%<br />
<strong>Rhode</strong> <strong>Island</strong> 159,175 136,352 10,288 14,385 86% 16%<br />
Student Mobility<br />
Source of Data for Table/Methodology<br />
<strong>Rhode</strong> <strong>Island</strong> Department of Elementary and Secondary<br />
Education, 2008-2009 school year.<br />
Charter Schools include: Highlander Charter School,<br />
Paul Cuffee Charter School, Kingston Hill<br />
Academy, International Charter School, Blackstone<br />
Academy, The Compass School, Beacon Charter<br />
School, and The Learning Community. Stateoperated<br />
schools include: The MET School, DCYF,<br />
Davies Career and Tech and the <strong>Rhode</strong> <strong>Island</strong><br />
School for the Deaf.<br />
Core cities are Central Falls, Newport, Pawtucket,<br />
Providence, West Warwick and Woonsocket.<br />
References<br />
1,5,9<br />
Reynolds, A. J., Chen, C. & Herbers, J. E. (2009,<br />
June). School mobility and educational success: A<br />
research synthesis and evidence on prevention. Paper<br />
presented at the National Research Council<br />
Workshop on the Impact of Mobility and Change<br />
on the Lives of Young Children, Schools and<br />
Neighborhoods, Washington, DC.<br />
2,4,6,7,10<br />
Burkam, D. T., Lee, V. E. & Dwyer, J. (2009,<br />
June). School mobility in the early elementary grades:<br />
Frequency and impact from nationally-representative<br />
data. Paper presented at the National Research<br />
Council Workshop on the Impact of Mobility and<br />
Change on the Lives of Young Children, Schools<br />
and Neighborhoods, Washington, DC.<br />
3,8,13,14<br />
Turner, M. A. & Berube, A. (2009). Vibrant<br />
neighborhoods, successful schools: What the federal<br />
government can do to foster both. Washington, DC:<br />
Urban Institute.<br />
11<br />
U.S. Census Bureau, American Community Survey,<br />
2006-2008. Table B07001.<br />
12<br />
U.S. Census Bureau, American Community Survey,<br />
2006-2008. Table B07012.<br />
15,16,17,18<br />
<strong>Rhode</strong> <strong>Island</strong> Department of Elementary and<br />
Secondary Education, 2008-2009 school year.<br />
19<br />
The Providence Plan analysis of 2007-2008 school year<br />
data from the <strong>Rhode</strong> <strong>Island</strong> Department of<br />
Elementary and Secondary Education.<br />
<strong>2010</strong> <strong>Rhode</strong> <strong>Island</strong> KIDS COUNT <strong>Factbook</strong> 135