2010 Rhode Island Kids Count Factbook
2010 Rhode Island Kids Count Factbook
2010 Rhode Island Kids Count Factbook

You also want an ePaper? Increase the reach of your titles
YUMPU automatically turns print PDFs into web optimized ePapers that Google loves.
0<br />
Eighth-Grade Reading Skills<br />
DEFINITION<br />
Eighth-grade reading skills is the<br />
percentage of eighth-grade students who<br />
scored at or above the proficiency level<br />
for reading on the New England Common<br />
Assessment Program (NECAP) test.<br />
SIGNIFICANCE<br />
Strong reading skills are essential for<br />
a student’s academic success in high<br />
school and college. Reading skills are<br />
also a powerful indicator of a student’s<br />
ability to contribute to and succeed in<br />
the workforce and their community. 1<br />
Literacy demands intensify dramatically<br />
upon entry into high school as students<br />
are expected to comprehend, synthesize<br />
and analyze increasingly complex texts<br />
across academic disciplines. Advanced<br />
literacy skills diverge from elementary<br />
literacy skills as early as 4th grade, along<br />
with the instructional needs associated<br />
with building these skills. 2,3<br />
Reading difficulties can persist over<br />
time with long-term consequences for<br />
youth. 4 Problems faced by struggling<br />
readers are exacerbated when they are<br />
English Language Learners, recent<br />
immigrants or have learning disabilities. 5<br />
Adolescents who are poor readers have<br />
difficulty succeeding in other core<br />
subjects and are more likely to drop out<br />
than their peers. 6<br />
At-risk adolescent students rarely<br />
receive intensive reading instruction. 7<br />
40<br />
30<br />
20<br />
10<br />
100%<br />
90%<br />
80%<br />
70%<br />
60%<br />
50%<br />
78%<br />
75%<br />
When literacy-specific 56% instruction is<br />
50%<br />
40%<br />
48%<br />
used as remedial support for struggling<br />
30%<br />
adolescent 20% students, the programs<br />
typically 10% serve only a small proportion<br />
0%<br />
of students who need assistance. 8<br />
White Asian Native Black Hispanic<br />
Additionally, these supplementary<br />
American All<br />
programs are generally insufficient for<br />
dealing with the pervasive low levels of<br />
adolescent literacy in many schools and<br />
communities. 9<br />
Integrating literacy strategies with<br />
traditional content-area instruction, and<br />
providing intervention support for<br />
struggling readers are key to improving<br />
adolescent literacy among all students. 10<br />
Schools with successful adolescent<br />
literacy programs have strong<br />
leadership, incorporate interdisciplinary<br />
teaching teams, target professional<br />
development, implement comprehensive<br />
literacy instruction strategies, and use<br />
student assessments effectively. 11,12<br />
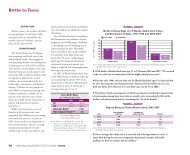
8th Grade NAEP Reading Proficiency<br />
1998 2009<br />
RI 32% 28%<br />
US 30% 30%<br />
National Rank* 37th<br />
New England Rank** 6th<br />
*1st is best; 50th is worst<br />
**1st is best; 6th is worst<br />
Source: National Center for Education Statistics. (<strong>2010</strong>).<br />
National Assessment of Educational Progress state<br />
profiles: Grade 8, reading 2009. Retrieved on March<br />
25, <strong>2010</strong> from www.nces.ed.gov<br />
70%<br />
Races<br />
40<br />
30<br />
20<br />
10<br />
0<br />
100%<br />
90%<br />
80%<br />
70%<br />
60%<br />
50%<br />
40%<br />
74%<br />
65%<br />
0% 0%<br />
White Asian Black Hispanic All Races C<br />
C<br />
45% 20<br />
<strong>Rhode</strong> 33% <strong>Island</strong> Public School 8th Grade 10 NECAP Reading Proficiency<br />
30%<br />
0<br />
20% By District Type, 2005-2009 By Race/Ethnicity, 2009<br />
10%<br />
0% Core Cities<br />
80%<br />
70%<br />
60%<br />
50%<br />
40%<br />
30%<br />
20%<br />
67%<br />
56%<br />
67%<br />
56%<br />
2005 Remainder of 2006 State 2007 2008<br />
<strong>Rhode</strong> <strong>Island</strong><br />
33%<br />
2005 2006 2007 2008<br />
79%<br />
70%<br />
2009<br />
51%<br />
100<br />
90<br />
80<br />
70<br />
60<br />
50<br />
40<br />
30<br />
100%<br />
90%<br />
80%<br />
70%<br />
60%<br />
50%<br />
40%<br />
30%<br />
20%<br />
10%<br />
0%<br />
78%<br />
75%<br />
56%<br />
50% 48%<br />
70%<br />
White Asian Native Black Hispanic<br />
American Races<br />
All<br />
Source: <strong>Rhode</strong> <strong>Island</strong> Department of Elementary and Secondary Education, New England Common Assessment Program<br />
(NECAP), October 2005 - October 2009.<br />
◆ In October 2009, 70% of <strong>Rhode</strong> <strong>Island</strong> eighth-graders scored at or above proficiency<br />
in reading, an increase from 56% in 2005. Proficiency levels increased between 2005 and<br />
2009 for students across the state. The greatest gains were made in the core cities, where<br />
8th grade reading proficiency rates increased from 33% to 51% between 2005 and 2009. 13<br />
◆ Sixteen percent of eighth-grade English Language Learners in <strong>Rhode</strong> <strong>Island</strong> scored at<br />
or above proficiency in reading in 2009. 14<br />
◆ Black, Hispanic and Native American students scored significantly lower than their<br />
White and Asian counterparts in <strong>Rhode</strong> <strong>Island</strong>. 15<br />
◆ Fifty-three percent of low-income eighth-grade students (determined by eligibility for<br />
the free or reduced-price lunch program) were proficient in reading in 2009, compared<br />
with 82% of higher-income eighth graders. 16<br />
◆ In <strong>Rhode</strong> <strong>Island</strong> in 2009, 29% of eighth-grade students receiving special education<br />
services were proficient in reading, compared with 79% of eighth graders in regular<br />
education programs. 17<br />
100<br />
90<br />
80<br />
70<br />
60<br />
50<br />
40<br />
30<br />
20<br />
10<br />
0<br />
100%<br />
90%<br />
80%<br />
70%<br />
60%<br />
50%<br />
40%<br />
30%<br />
20%<br />
10%<br />
0%<br />
80%<br />
70%<br />
60%<br />
50%<br />
40%<br />
30%<br />
20%<br />
67%<br />
56%<br />
33%<br />
67%<br />
56%<br />
33%<br />
2005 2<br />
2005 2006<br />
138 <strong>2010</strong> <strong>Rhode</strong> <strong>Island</strong> KIDS COUNT <strong>Factbook</strong> / Education