

5 Year Strategic Plan 2005/06 - Department of Education
5 Year Strategic Plan 2005/06 - Department of Education
5 Year Strategic Plan 2005/06 - Department of Education

Create successful ePaper yourself
Turn your PDF publications into a flip-book with our unique Google optimized e-Paper software.
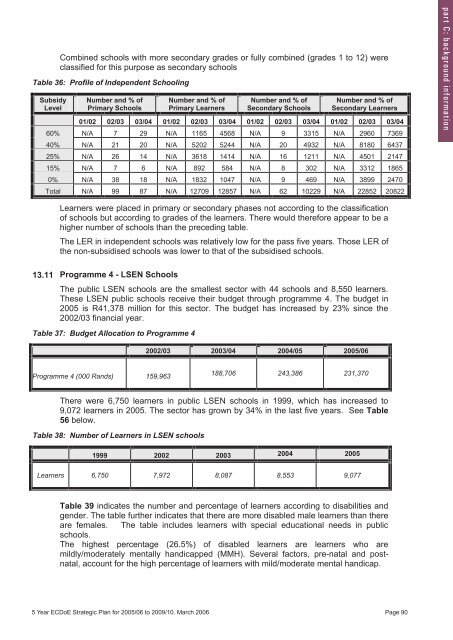
Combined schools with more secondary grades or fully combined (grades 1 to 12) were<br />
classified for this purpose as secondary schools<br />
Table 36: Pr<strong>of</strong>ile <strong>of</strong> Independent Schooling<br />
Subsidy<br />
Level<br />
Number and % <strong>of</strong><br />
Primary Schools<br />
Number and % <strong>of</strong><br />
Primary Learners<br />
Number and % <strong>of</strong><br />
Secondary Schools<br />
Number and % <strong>of</strong><br />
Secondary Learners<br />
01/02 02/03 03/04 01/02 02/03 03/04 01/02 02/03 03/04 01/02 02/03 03/04<br />
60% N/A 7 29 N/A 1165 4568 N/A 9 3315 N/A 2960 7369<br />
40% N/A 21 20 N/A 5202 5244 N/A 20 4932 N/A 8180 6437<br />
25% N/A 26 14 N/A 3618 1414 N/A 16 1211 N/A 4501 2147<br />
15% N/A 7 6 N/A 892 584 N/A 8 302 N/A 3312 1865<br />
0% N/A 38 18 N/A 1832 1047 N/A 9 469 N/A 3899 2470<br />
Total N/A 99 87 N/A 12709 12857 N/A 62 10229 N/A 22852 20822<br />
p a r t C : b a c k g r o u n d i n f o r m a t i o n<br />
Learners were placed in primary or secondary phases not according to the classification<br />
<strong>of</strong> schools but according to grades <strong>of</strong> the learners. There would therefore appear to be a<br />
higher number <strong>of</strong> schools than the preceding table.<br />
The LER in independent schools was relatively low for the pass five years. Those LER <strong>of</strong><br />
the non-subsidised schools was lower to that <strong>of</strong> the subsidised schools.<br />
13.11 Programme 4 4 – - LSEN Schools<br />
The public LSEN schools are the smallest sector with 44 schools and 8,550 learners.<br />
These LSEN public schools receive their budget through programme 4. The budget in<br />
<strong>2005</strong> is R41,378 million for this sector. The budget has increased by 23% since the<br />
2002/03 financial year.<br />
Table 37: Budget Allocation to Programme 4<br />
2002/03 2003/04 2004/05 <strong>2005</strong>/<strong>06</strong><br />
Programme 4 (000 Rands) 159,963<br />
188,7<strong>06</strong> 243,386 231,370<br />
There were 6,750 learners in public LSEN schools in 1999, which has increased to<br />
9,072 learners in <strong>2005</strong>. The sector has grown by 34% in the last five years. See Table<br />
56 below.<br />
Table 38: Number <strong>of</strong> Learners in LSEN schools<br />
1999 2002 2003 2004 <strong>2005</strong><br />
Learners 6,750 7,972 8,087 8,553 9,077<br />
Table 39 indicates the number and percentage <strong>of</strong> learners according to disabilities and<br />
gender. The table further indicates that there are more disabled male learners than there<br />
are females. The table includes learners with special educational needs in public<br />
schools.<br />
The highest percentage (26.5%) <strong>of</strong> disabled learners are learners who are<br />
mildly/moderately mentally handicapped (MMH). Several factors, pre-natal and postnatal,<br />
account for the high percentage <strong>of</strong> learners with mild/moderate mental handicap.<br />
5 <strong>Year</strong> ECDoE <strong>Strategic</strong> <strong>Plan</strong> for <strong>2005</strong>/<strong>06</strong> to 2009/10. March 20<strong>06</strong> Page 90<br />
5 <strong>Year</strong> ECDoE <strong>Strategic</strong> <strong>Plan</strong> for <strong>2005</strong>-<strong>06</strong> to 2009-10. 21 F (4)Page 86


