

5 Year Strategic Plan 2005/06 - Department of Education
5 Year Strategic Plan 2005/06 - Department of Education
5 Year Strategic Plan 2005/06 - Department of Education

You also want an ePaper? Increase the reach of your titles
YUMPU automatically turns print PDFs into web optimized ePapers that Google loves.
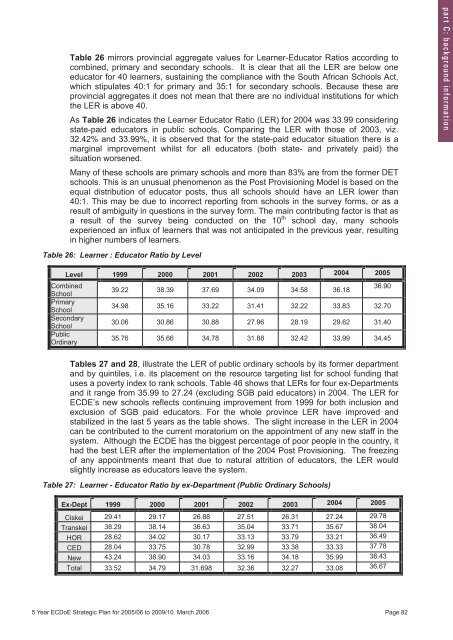
Table 26 mirrors provincial aggregate values for Learner-Educator Ratios according to<br />
combined, primary and secondary schools. It is clear that all the LER are below one<br />
educator for 40 learners, sustaining the compliance with the South African Schools Act,<br />
which stipulates 40:1 for primary and 35:1 for secondary schools. Because these are<br />
provincial aggregates it does not mean that there are no individual institutions for which<br />
the LER is above 40.<br />
As Table 26 indicates the Learner Educator Ratio (LER) for 2004 was 33.99 considering<br />
state-paid educators in public schools. Comparing the LER with those <strong>of</strong> 2003, viz.<br />
32.42% and 33.99%, it is observed that for the state-paid educator situation there is a<br />
marginal improvement whilst for all educators (both state- and privately paid) the<br />
situation worsened.<br />
Many <strong>of</strong> these schools are primary schools and more than 83% are from the former DET<br />
schools. This is an unusual phenomenon as the Post Provisioning Model is based on the<br />
equal distribution <strong>of</strong> educator posts, thus all schools should have an LER lower than<br />
40:1. This may be due to incorrect reporting from schools in the survey forms, or as a<br />
result <strong>of</strong> ambiguity in questions in the survey form. The main contributing factor is that as<br />
a result <strong>of</strong> the survey being conducted on the 10 th school day, many schools<br />
experienced an influx <strong>of</strong> learners that was not anticipated in the previous year, resulting<br />
in higher numbers <strong>of</strong> learners.<br />
p a r t C : b a c k g r o u n d i n f o r m a t i o n<br />
Table 26: Learner : Educator Ratio by Level<br />
Level 1999 2000 2001 2002 2003 2004 <strong>2005</strong><br />
Combined<br />
36.90<br />
39.22 38.39 37.69 34.09 34.58 36.18<br />
School<br />
Primary<br />
School<br />
34.98 35.16 33.22 31.41 32.22 33.83 32.70<br />
Secondary<br />
School<br />
30.<strong>06</strong> 30.86 30.88 27.96 28.19 29.62 31.40<br />
Public<br />
Ordinary<br />
35.76 35.66 34.78 31.88 32.42 33.99 34.45<br />
Tables 27 and 28, illustrate the LER <strong>of</strong> public ordinary schools by its former department<br />
and by quintiles, i.e. its placement on the resource targeting list for school funding that<br />
uses a poverty index to rank schools. Table 46 shows that LERs for four ex-<strong>Department</strong>s<br />
and it range from 35.99 to 27.24 (excluding SGB paid educators) in 2004. The LER for<br />
ECDE’s new schools reflects continuing improvement from 1999 for both inclusion and<br />
exclusion <strong>of</strong> SGB paid educators. For the whole province LER have improved and<br />
stabilized in the last 5 years as the table shows. The slight increase in the LER in 2004<br />
can be contributed to the current moratorium on the appointment <strong>of</strong> any new staff in the<br />
system. Although the ECDE has the biggest percentage <strong>of</strong> poor people in the country, it<br />
had the best LER after the implementation <strong>of</strong> the 2004 Post Provisioning. The freezing<br />
<strong>of</strong> any appointments meant that due to natural attrition <strong>of</strong> educators, the LER would<br />
slightly increase as educators leave the system.<br />
Table 27: Learner - Educator Ratio by ex-<strong>Department</strong> (Public Ordinary Schools)<br />
Ex-Dept 1999 2000 2001 2002 2003 2004 <strong>2005</strong><br />
Ciskei 29.41 29.17 26.88 27.51 26.31 27.24 29.78<br />
Transkei 38.29 38.14 36.63 35.04 33.71 35.67 38.04<br />
HOR 28.62 34.02 30.17 33.13 33.79 33.21 36.49<br />
CED 28.04 33.75 30.78 32.99 33.38 33.33 37.78<br />
New 43.24 38.90 34.03 33.16 34.18 35.99 38.43<br />
Total 33.52 34.79 31.698 32.36 32.27 33.08 36.67<br />
5 <strong>Year</strong> ECDoE <strong>Strategic</strong> <strong>Plan</strong> for <strong>2005</strong>/<strong>06</strong> to 2009/10. March 20<strong>06</strong> Page 82<br />
5 <strong>Year</strong> ECDoE <strong>Strategic</strong> <strong>Plan</strong> for <strong>2005</strong>-<strong>06</strong> to 2009-10. 21 F (4)Page 78


