

5 Year Strategic Plan 2005/06 - Department of Education
5 Year Strategic Plan 2005/06 - Department of Education
5 Year Strategic Plan 2005/06 - Department of Education

Create successful ePaper yourself
Turn your PDF publications into a flip-book with our unique Google optimized e-Paper software.
The map shows that the highest average population densities are to be found in the districts <strong>of</strong><br />
Port Elizabeth (302 per sq km) and East London (156 per sq km) followed by Mthatha and<br />
Libode. The districts <strong>of</strong> Libode, Bizana and Lusikisiki, which are located in the former Transkei,<br />
all have population densities in excess <strong>of</strong> 100 people per square kilometer. This is particularly<br />
high given that there are no large established urban centres in these districts and is indicative<br />
<strong>of</strong> the dense rural and peri-urban settlement referred to earlier.<br />
Graaff-Reinet has the lowest population density at just 3 people per square kilometer, followed<br />
by Cradock with 5 and Sterkspruit with 10.<br />
p a r t C : b a c k g r o u n d i n f o r m a t i o n<br />
The ward-based population density map reveals that population densities vary considerably<br />
within districts. Large parts <strong>of</strong> Port Elizabeth District for example are fairly sparsely populated,<br />
notably the eastern portion that includes part <strong>of</strong> Sundays River Valley Municipality. Equally,<br />
East London and Mthatha Districts are not uniformly settled. In the case <strong>of</strong> East London<br />
District, Mdantsane and the city <strong>of</strong> East London account for the most densely settled areas. In<br />
Mthatha district, the highest densities are closely associated with the capital city. Many <strong>of</strong> the<br />
north eastern districts are settled at densities which consistently exceed 100 people per square<br />
kilometer.<br />
13.3.2 Population <strong>of</strong> School-going Age (7 – 18 years)<br />
The Eastern Cape has one <strong>of</strong> the most ‘youthful’ populations <strong>of</strong> all the provinces. Nearly half<br />
<strong>of</strong> its population (47%) are below the age <strong>of</strong> 19 (see Graph 3 below). Only Limpopo province<br />
has a higher proportion <strong>of</strong> young people with 50% below age 19. By way <strong>of</strong> comparison this<br />
figure is only 30% in Gauteng. This means that the tax base in the Eastern Cape and<br />
Limpopo provinces will be far lower by comparison, and that each employed person is likely to<br />
have many more dependents. It also means that the demand for education will remain high –<br />
in the case <strong>of</strong> the Eastern Cape, 15% <strong>of</strong> the population had yet to enter school in 2001.<br />
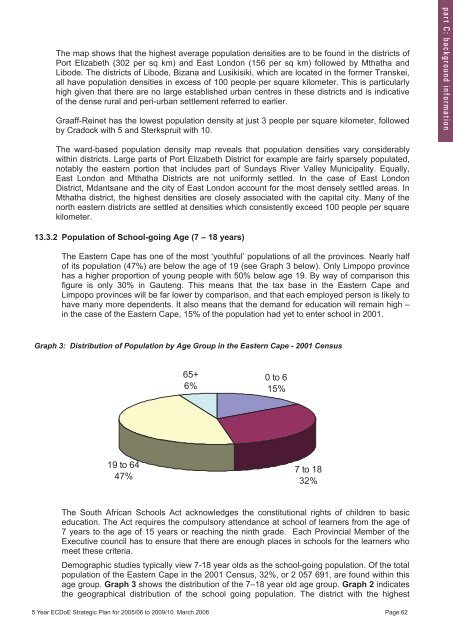
Graph 3: Distribution <strong>of</strong> Population by Age Group in the Eastern Cape - 2001 Census<br />
65+<br />
6%<br />
0 to 6<br />
15%<br />
19 to 64<br />
47%<br />
7 to 18<br />
32%<br />
The South African Schools Act acknowledges the constitutional rights <strong>of</strong> children to basic<br />
education. The Act requires the compulsory attendance at school <strong>of</strong> learners from the age <strong>of</strong><br />
7 years to the age <strong>of</strong> 15 years or reaching the ninth grade. Each Provincial Member <strong>of</strong> the<br />
Executive council has to ensure that there are enough places in schools for the learners who<br />
meet these criteria.<br />
Demographic studies typically view 7-18 year olds as the school-going population. Of the total<br />
population <strong>of</strong> the Eastern Cape in the 2001 Census, 32%, or 2 057 691, are found within this<br />
age group. Graph 3 shows the distribution <strong>of</strong> the 7–18 year old age group. Graph 2 indicates<br />
the geographical distribution <strong>of</strong> the school going population. The district with the highest<br />
5 <strong>Year</strong> ECDoE <strong>Strategic</strong> <strong>Plan</strong> for <strong>2005</strong>/<strong>06</strong> to 2009/10. March 20<strong>06</strong> Page 62<br />
5 <strong>Year</strong> ECDoE <strong>Strategic</strong> <strong>Plan</strong> for <strong>2005</strong>-<strong>06</strong> to 2009-10. 21 F (3) Page 58


