

5 Year Strategic Plan 2005/06 - Department of Education
5 Year Strategic Plan 2005/06 - Department of Education
5 Year Strategic Plan 2005/06 - Department of Education

Create successful ePaper yourself
Turn your PDF publications into a flip-book with our unique Google optimized e-Paper software.
Lusikisiki and Uitenhage. A total <strong>of</strong> sixteen districts experienced a positive population growth<br />
from 1996 to 2001 and eight a population decline. The most severe population decrease was<br />
in Maluti district, where the population decreased by 10% during the period.<br />
It is important to note that many <strong>of</strong> the identified high-growth districts are located in more<br />
peripheral parts <strong>of</strong> the province, which traditionally have been under-served in terms <strong>of</strong><br />
education. Many are facing severe physical infrastructure backlogs and this presents<br />
additional challenges for the <strong>Department</strong> if a legacy <strong>of</strong> poor provision is coincident with rising<br />
demand for education due to population growth. Settlement patterns in these areas can <strong>of</strong>ten<br />
be characterized as dense rural subsistence and peri-urban and population is less likely to be<br />
clustered around formal towns, which presents special challenges for education delivery.<br />
The ongoing challenge in these areas is to improve access to schooling, more especially to<br />
secondary and further education and training facilities for the high number <strong>of</strong> non-urban<br />
dwellers.<br />
It should be noted that Port Elizabeth, East London and Mthatha all experienced population<br />
growth <strong>of</strong> 4% or more, so demand for education in the main urban centres is likely to remain<br />
buoyant.<br />
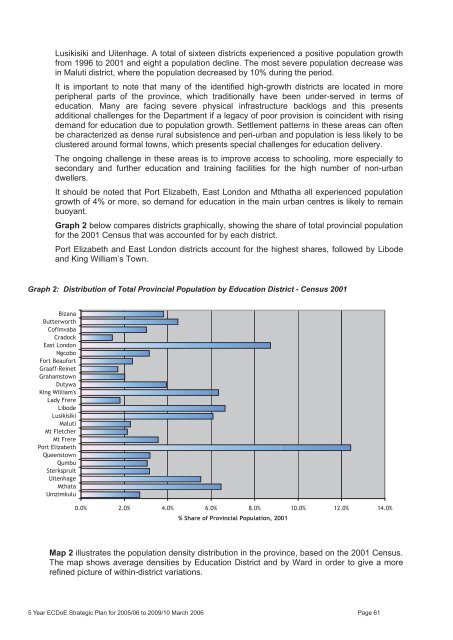
Graph 2 below compares districts graphically, showing the share <strong>of</strong> total provincial population<br />
for the 2001 Census that was accounted for by each district.<br />
Port Elizabeth and East London districts account for the highest shares, followed by Libode<br />
and King William’s Town.<br />
Graph 2: Distribution <strong>of</strong> Total Provincial Population by <strong>Education</strong> District - Census 2001<br />
Bizana<br />
Butterworth<br />
C<strong>of</strong>imvaba<br />
Cradock<br />
East London<br />
Ngcobo<br />
Fort Beaufort<br />
Graaff-Reinet<br />
Grahamstown<br />
Dutywa<br />
King William's<br />
Lady Frere<br />
Libode<br />
Lusikisiki<br />
Maluti<br />
Mt Fletcher<br />
Mt Frere<br />
Port Elizabeth<br />
Queenstown<br />
Qumbu<br />
Sterkspruit<br />
Uitenhage<br />
Mthata<br />
Umzimkulu<br />
0.0% 2.0% 4.0% 6.0% 8.0% 10.0% 12.0% 14.0%<br />
% Share <strong>of</strong> Provincial Population, 2001<br />
Map 2 illustrates the population density distribution in the province, based on the 2001 Census.<br />
The map shows average densities by <strong>Education</strong> District and by Ward in order to give a more<br />
refined picture <strong>of</strong> within-district variations.<br />
5 <strong>Year</strong> ECDoE <strong>Strategic</strong> <strong>Plan</strong> for <strong>2005</strong>/<strong>06</strong> <strong>2005</strong>-<strong>06</strong> to 2009/10 2009-10. March 21 F (3) 20<strong>06</strong> Page 61 Page 57


