

5 Year Strategic Plan 2005/06 - Department of Education
5 Year Strategic Plan 2005/06 - Department of Education
5 Year Strategic Plan 2005/06 - Department of Education

You also want an ePaper? Increase the reach of your titles
YUMPU automatically turns print PDFs into web optimized ePapers that Google loves.
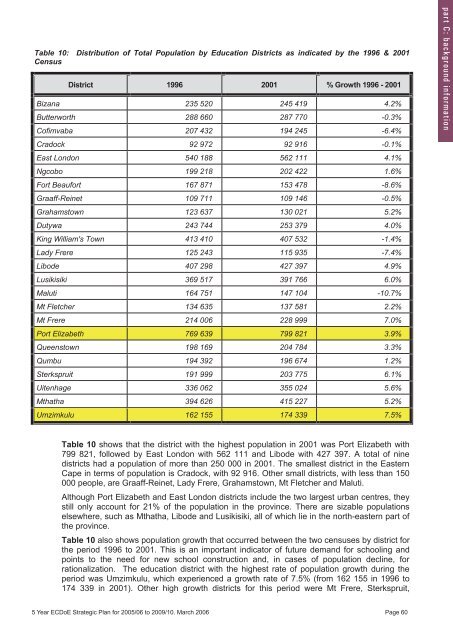
Table 10: Distribution <strong>of</strong> Total Population by <strong>Education</strong> Districts as indicated by the 1996 & 2001<br />
Census<br />
District 1996 2001 % Growth 1996 - 2001<br />
Bizana 235 520 245 419 4.2%<br />
Butterworth 288 660 287 770 -0.3%<br />
C<strong>of</strong>imvaba 207 432 194 245 -6.4%<br />
Cradock 92 972 92 916 -0.1%<br />
East London 540 188 562 111 4.1%<br />
Ngcobo 199 218 202 422 1.6%<br />
Fort Beaufort 167 871 153 478 -8.6%<br />
Graaff-Reinet 109 711 109 146 -0.5%<br />
Grahamstown 123 637 130 021 5.2%<br />
Dutywa 243 744 253 379 4.0%<br />
King William's Town 413 410 407 532 -1.4%<br />
Lady Frere 125 243 115 935 -7.4%<br />
Libode 407 298 427 397 4.9%<br />
Lusikisiki 369 517 391 766 6.0%<br />
Maluti 164 751 147 104 -10.7%<br />
Mt Fletcher 134 635 137 581 2.2%<br />
Mt Frere 214 0<strong>06</strong> 228 999 7.0%<br />
Port Elizabeth 769 639 799 821 3.9%<br />
Queenstown 198 169 204 784 3.3%<br />
Qumbu 194 392 196 674 1.2%<br />
Sterkspruit 191 999 203 775 6.1%<br />
Uitenhage 336 <strong>06</strong>2 355 024 5.6%<br />
Mthatha 394 626 415 227 5.2%<br />
Umzimkulu 162 155 174 339 7.5%<br />
p a r t C : b a c k g r o u n d i n f o r m a t i o n<br />
Table 10 shows that the district with the highest population in 2001 was Port Elizabeth with<br />
799 821, followed by East London with 562 111 and Libode with 427 397. A total <strong>of</strong> nine<br />
districts had a population <strong>of</strong> more than 250 000 in 2001. The smallest district in the Eastern<br />
Cape in terms <strong>of</strong> population is Cradock, with 92 916. Other small districts, with less than 150<br />
000 people, are Graaff-Reinet, Lady Frere, Grahamstown, Mt Fletcher and Maluti.<br />
Although Port Elizabeth and East London districts include the two largest urban centres, they<br />
still only account for 21% <strong>of</strong> the population in the province. There are sizable populations<br />
elsewhere, such as Mthatha, Libode and Lusikisiki, all <strong>of</strong> which lie in the north-eastern part <strong>of</strong><br />
the province.<br />
Table 10 also shows population growth that occurred between the two censuses by district for<br />
the period 1996 to 2001. This is an important indicator <strong>of</strong> future demand for schooling and<br />
points to the need for new school construction and, in cases <strong>of</strong> population decline, for<br />
rationalization. The education district with the highest rate <strong>of</strong> population growth during the<br />
period was Umzimkulu, which experienced a growth rate <strong>of</strong> 7.5% (from 162 155 in 1996 to<br />
174 339 in 2001). Other high growth districts for this period were Mt Frere, Sterkspruit,<br />
5 <strong>Year</strong> ECDoE <strong>Strategic</strong> <strong>Plan</strong> for <strong>2005</strong>/<strong>06</strong> to 2009/10. March 20<strong>06</strong> Page 60<br />
5 <strong>Year</strong> ECDoE <strong>Strategic</strong> <strong>Plan</strong> for <strong>2005</strong>-<strong>06</strong> to 2009-10. 21 F (3) Page 56


