

5 Year Strategic Plan 2005/06 - Department of Education
5 Year Strategic Plan 2005/06 - Department of Education
5 Year Strategic Plan 2005/06 - Department of Education

You also want an ePaper? Increase the reach of your titles
YUMPU automatically turns print PDFs into web optimized ePapers that Google loves.
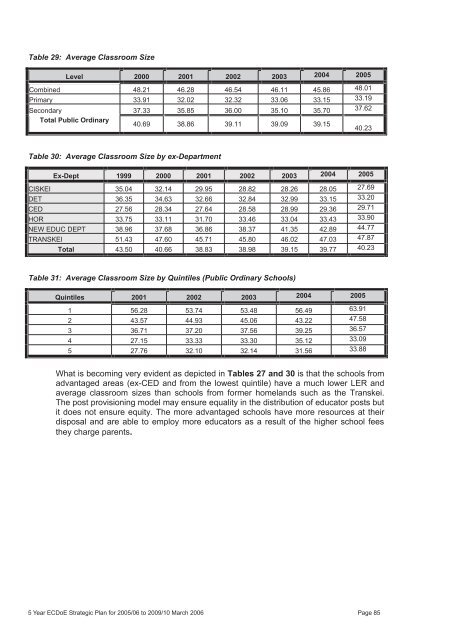
Table 29: Average Classroom Size<br />
Level 2000 2001 2002 2003 2004 <strong>2005</strong><br />
Combined 48.21 46.28 46.54 46.11 45.86 48.01<br />
Primary 33.91 32.02 32.32 33.<strong>06</strong> 33.15 33.19<br />
Secondary 37.33 35.85 36.00 35.10 35.70 37.62<br />
Total Public Ordinary<br />
40.69 38.86 39.11 39.09 39.15<br />
40.23<br />
Table 30: Average Classroom Size by ex-<strong>Department</strong><br />
Ex-Dept 1999 2000 2001 2002 2003 2004 <strong>2005</strong><br />
CISKEI 35.04 32.14 29.95 28.82 28.26 28.05 27.69<br />
DET 36.35 34.63 32.66 32.84 32.99 33.15 33.20<br />
CED 27.56 28.34 27.64 28.58 28.99 29.36 29.71<br />
HOR 33.75 33.11 31.70 33.46 33.04 33.43 33.90<br />
NEW EDUC DEPT 38.96 37.68 36.86 38.37 41.35 42.89 44.77<br />
TRANSKEI 51.43 47.60 45.71 45.80 46.02 47.03 47.87<br />
Total 43.50 40.66 38.83 38.98 39.15 39.77 40.23<br />
Table 31: Average Classroom Size by Quintiles (Public Ordinary Schools)<br />
Quintiles 2001 2002 2003 2004 <strong>2005</strong><br />
1 56.28 53.74 53.48 56.49 63.91<br />
2 43.57 44.93 45.<strong>06</strong> 43.22 47.58<br />
3 36.71 37.20 37.56 39.25 36.57<br />
4 27.15 33.33 33.30 35.12 33.09<br />
5 27.76 32.10 32.14 31.56 33.88<br />
What is becoming very evident as depicted in Tables 27 and 30 is that the schools from<br />
advantaged areas (ex-CED and from the lowest quintile) have a much lower LER and<br />
average classroom sizes than schools from former homelands such as the Transkei.<br />
The post provisioning model may ensure equality in the distribution <strong>of</strong> educator posts but<br />
it does not ensure equity. The more advantaged schools have more resources at their<br />
disposal and are able to employ more educators as a result <strong>of</strong> the higher school fees<br />
they charge parents.<br />
5 <strong>Year</strong> ECDoE <strong>Strategic</strong> <strong>Plan</strong> for <strong>2005</strong>/<strong>06</strong> <strong>2005</strong>-<strong>06</strong> to 2009/10 2009-10. March 21 F (4)Page 20<strong>06</strong> 81<br />
Page 85


