

5 Year Strategic Plan 2005/06 - Department of Education
5 Year Strategic Plan 2005/06 - Department of Education
5 Year Strategic Plan 2005/06 - Department of Education

You also want an ePaper? Increase the reach of your titles
YUMPU automatically turns print PDFs into web optimized ePapers that Google loves.
13.9. Programme 2 - Public Ordinary School <strong>Education</strong><br />
13.9.1 Demographic pressures and access issues<br />
The following information refers to public ordinary, independent and special schools. It is<br />
nevertheless recommended that it appear in this section, considering that public ordinary<br />
schools form the bulk <strong>of</strong> the total.<br />
p a r t C : b a c k g r o u n d i n f o r m a t i o n<br />
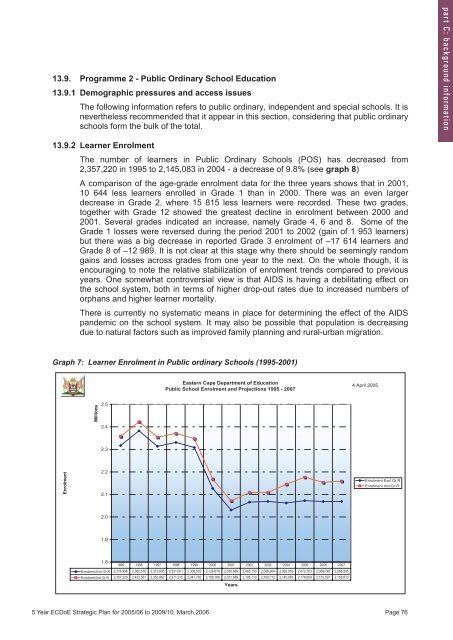
13.9.2 Learner Enrolment<br />
The number <strong>of</strong> learners in Public Ordinary Schools (POS) has decreased from<br />
2,357,220 in 1995 to 2,145,083 in 2004 - a decrease <strong>of</strong> 9.8% (see graph 8)<br />
A comparison <strong>of</strong> the age-grade enrolment data for the three years shows that in 2001,<br />
10 644 less learners enrolled in Grade 1 than in 2000. There was an even larger<br />
decrease in Grade 2, where 15 815 less learners were recorded. These two grades,<br />
together with Grade 12 showed the greatest decline in enrolment between 2000 and<br />
2001. Several grades indicated an increase, namely Grade 4, 6 and 8. Some <strong>of</strong> the<br />
Grade 1 losses were reversed during the period 2001 to 2002 (gain <strong>of</strong> 1 953 learners)<br />
but there was a big decrease in reported Grade 3 enrolment <strong>of</strong> –17 614 learners and<br />
Grade 8 <strong>of</strong> –12 989. It is not clear at this stage why there should be seemingly random<br />
gains and losses across grades from one year to the next. On the whole though, it is<br />
encouraging to note the relative stabilization <strong>of</strong> enrolment trends compared to previous<br />
years. One somewhat controversial view is that AIDS is having a debilitating effect on<br />
the school system, both in terms <strong>of</strong> higher drop-out rates due to increased numbers <strong>of</strong><br />
orphans and higher learner mortality.<br />
There is currently no systematic means in place for determining the effect <strong>of</strong> the AIDS<br />
pandemic on the school system. It may also be possible that population is decreasing<br />
due to natural factors such as improved family planning and rural-urban migration.<br />
Graph 7: Learner Enrolment in Public ordinary Schools (1995-2001)<br />
Eastern Cape <strong>Department</strong> <strong>of</strong> <strong>Education</strong><br />
Public School Enrolment and Projections 1995 - 2007<br />
4 April <strong>2005</strong><br />
Millions<br />
2.5<br />
2.4<br />
2.3<br />
Enrolment<br />
2.2<br />
2.1<br />
Enrolment Excl Gr R<br />
Enrolment Incl Gr R<br />
2.0<br />
1.9<br />
1.8<br />
1995 1996 1997 1998 1999 2000 2001 2002 2003 2004 <strong>2005</strong> 20<strong>06</strong> 2007<br />
Enrolment Excl Gr R 2,316,998 2,382,576 2,313,605 2,331,001 2,308,532 2,126,676 2,030,689 2,<strong>06</strong>5,750 2,<strong>06</strong>8,904 2,<strong>06</strong>2,052 2,072,703 2,<strong>06</strong>8,748 2,<strong>06</strong>8,595<br />
Enrolment Incl Gr R 2,357,220 2,422,551 2,353,962 2,371,215 2,347,782 2,168,196 2,071,689 2,108,110 2,108,712 2,145,083 2,176,659 2,153,597 2,158,813<br />
<strong>Year</strong>s<br />
5 <strong>Year</strong> ECDoE <strong>Strategic</strong> <strong>Plan</strong> for <strong>2005</strong>/<strong>06</strong> to 2009/10. March 20<strong>06</strong> Page 76<br />
5 <strong>Year</strong> ECDoE <strong>Strategic</strong> <strong>Plan</strong> for <strong>2005</strong>-<strong>06</strong> to 2009-10. 21 F (4)Page 72


