

5 Year Strategic Plan 2005/06 - Department of Education
5 Year Strategic Plan 2005/06 - Department of Education
5 Year Strategic Plan 2005/06 - Department of Education

You also want an ePaper? Increase the reach of your titles
YUMPU automatically turns print PDFs into web optimized ePapers that Google loves.
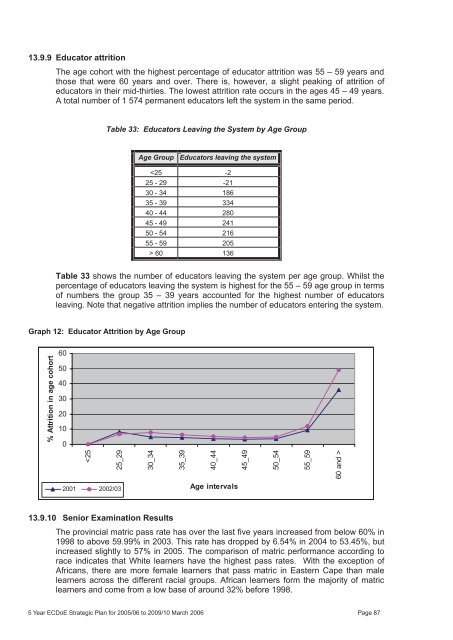
13.9.9 Educator attrition<br />
The age cohort with the highest percentage <strong>of</strong> educator attrition was 55 – 59 years and<br />
those that were 60 years and over. There is, however, a slight peaking <strong>of</strong> attrition <strong>of</strong><br />
educators in their mid-thirties. The lowest attrition rate occurs in the ages 45 – 49 years.<br />
A total number <strong>of</strong> 1 574 permanent educators left the system in the same period.<br />
Table 33: Educators Leaving the System by Age Group<br />
Age Group Educators leaving the system<br />
60 136<br />
Table 33 shows the number <strong>of</strong> educators leaving the system per age group. Whilst the<br />
percentage <strong>of</strong> educators leaving the system is highest for the 55 – 59 age group in terms<br />
<strong>of</strong> numbers the group 35 – 39 years accounted for the highest number <strong>of</strong> educators<br />
leaving. Note that negative attrition implies the number <strong>of</strong> educators entering the system.<br />
Graph 12: Educator Attrition by Age Group<br />
% Attrition in age cohort<br />
60<br />
50<br />
40<br />
30<br />
20<br />
10<br />
0<br />
<br />
2001 2002/03<br />
Age intervals<br />
13.9.10 Senior Examination Results<br />
The provincial matric pass rate has over the last five years increased from below 60% in<br />
1998 to above 59.99% in 2003. This rate has dropped by 6.54% in 2004 to 53.45%, but<br />
increased slightly to 57% in <strong>2005</strong>. The comparison <strong>of</strong> matric performance according to<br />
race indicates that White learners have the highest pass rates. With the exception <strong>of</strong><br />
Africans, there are more female learners that pass matric in Eastern Cape than male<br />
learners across the different racial groups. African learners form the majority <strong>of</strong> matric<br />
learners and come from a low base <strong>of</strong> around 32% before 1998.<br />
5 <strong>Year</strong> ECDoE <strong>Strategic</strong> <strong>Plan</strong> for <strong>2005</strong>/<strong>06</strong> <strong>2005</strong>-<strong>06</strong> to 2009/10 2009-10. March 21 F (4)Page 20<strong>06</strong> 83<br />
Page 87


