

National Accounts 1988-1993. Institutional Sector Accounts
National Accounts 1988-1993. Institutional Sector Accounts
National Accounts 1988-1993. Institutional Sector Accounts

You also want an ePaper? Increase the reach of your titles
YUMPU automatically turns print PDFs into web optimized ePapers that Google loves.
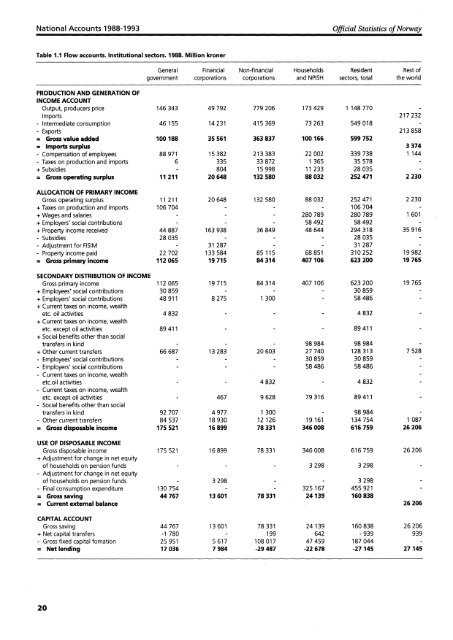
<strong>National</strong> <strong>Accounts</strong> <strong>1988</strong>-1993<br />
Official Statistics of Norway<br />
Table 1.1 Flow accounts. <strong>Institutional</strong> sectors. <strong>1988</strong>. Million kroner<br />
General Financial Non-financial Households Resident Rest of<br />
government corporations corporations and NPISH sectors, total the world<br />
PRODUCTION AND GENERATION OF<br />
INCOME ACCOUNT<br />
Output, producers price 146 343 49 792 779 206 173 429 1 148 770<br />
Imports 217 232<br />
- Intermediate consumption 46 155 14 231 415 369 73 263 549 018<br />
- Exports 213 858<br />
= Gross value added 100 188 35 561 363 837 100 166 599 752<br />
= Imports surplus 3 374<br />
- Compensation of employees 88 971 15 382 213 383 22 002 339 738 1 144<br />
- Taxes on production and imports 6 335 33 872 1 365 35 578<br />
+ Subsidies 804 15 998 11 233 28 035<br />
= Gross operating surplus 11 211 20 648 132 580 88 032 252 471 2 230<br />
ALLOCATION OF PRIMARY INCOME<br />
Gross operating surplus 11 211 20 648 132 580 88 032 252 471 2 230<br />
+ Taxes on production and imports 106 704 106 704<br />
+ Wages and salaries 280 789 280 789 1 601<br />
+ Employers' social contributions 58 492 58 492<br />
+ Property income received 44 887 163 938 36 849 48 644 294 318 35 916<br />
- Subsidies 28 035 - 28 035<br />
- Adjustment for FISIM 31 287 31 287<br />
- Property income paid 22 702 133 584 85 115 68 851 310 252 19 982<br />
= Gross primary income 112 065 19 715 84 314 407 106 623 200 19 765<br />
SECONDARY DISTRIBUTION OF INCOME<br />
Gross primary income 112 065 19 715 84 314 407 106 623 200 19 765<br />
+ Employees' social contributions 30 859 - 30 859<br />
+ Employers' social contributions 48 911 8 275 1 300 58 486<br />
+ Current taxes on income, wealth<br />
etc. oil activities 4 832 4 832<br />
+ Current taxes on income, wealth<br />
etc. except oil activities 89 411 - 89 411<br />
+ Social benefits other than social<br />
transfers in kind - 98 984 98 984<br />
+ Other current transfers 66 687 13 283 20 603 27 740 128 313 7 528<br />
- Employees' social contributions - - 30 859 30 859<br />
- Employers' social contributions - - 58 486 58 486<br />
- Current taxes on income, wealth<br />
etc.oil activities 4 832 4 832<br />
- Current taxes on income, wealth<br />
etc. except oil activities - 467 9 628 79 316 89 411<br />
- Social benefits other than social<br />
transfers in kind 92 707 4 977 1 300 98 984<br />
- Other current transfers 84 537 18 930 12 126 19 161 134 754 1 087<br />
= Gross disposable income 175 521 16 899 78 331 346 008 616 759 26 206<br />
USE OF DISPOSABLE INCOME<br />
Gross disposable income 175 521 16 899 78 331 346 008 616 759 26 206<br />
+ Adjustment for change in net equity<br />
of households on pension funds 3 298 3 298<br />
- Adjustment for change in net equity<br />
of households on pension funds 3 298 3 298<br />
- Final consumption expenditure 130 754 325 167 455 921<br />
= Gross saving 44 767 13 601 78 331 24 139 160 838<br />
= Current external balance 26 206<br />
CAPITAL ACCOUNT<br />
Gross saving 44 767 13 601 78 331 24 139 160 838 26 206<br />
+ Net capital transfers -1 780 199 642 -939 939<br />
- Gross fixed capital fomation 25 951 5 617 108 017 47 459 187 044<br />
= Net lending 17 036 7 984 -29487 -22678 -27145 27 145<br />
20


