

National Accounts 1988-1993. Institutional Sector Accounts
National Accounts 1988-1993. Institutional Sector Accounts
National Accounts 1988-1993. Institutional Sector Accounts

Create successful ePaper yourself
Turn your PDF publications into a flip-book with our unique Google optimized e-Paper software.
<strong>National</strong> <strong>Accounts</strong> <strong>1988</strong>-1993<br />
Official Statistics of Norway<br />
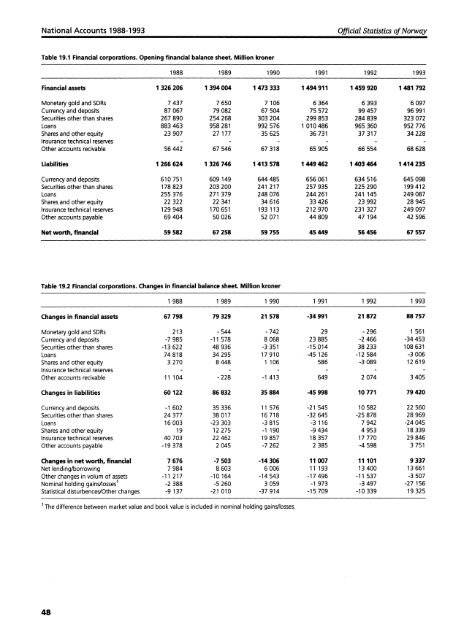
Table 19.1 Financial corporations. Opening financial balance sheet. Million kroner<br />
<strong>1988</strong> 1989 1990 1991 1992 1993<br />
Financial assets 1 326 206 1 394 004 1 473 333 1 494 911 1 459 920 1 481 792<br />
Monetary gold and SDRs 7 437 7 650 7 106 6 364 6 393 6 097<br />
Currency and deposits 87 067 79 082 67 504 75 572 99 457 96 991<br />
Securities other than shares 267 890 254 268 303 204 299 853 284 839 323 072<br />
Loans 883 463 958 281 992 576 1 010 486 965 360 952 776<br />
Shares and other equity 23 907 27 177 35 625 36 731 37 317 34 228<br />
Insurance technical reserves - - - - -<br />
Other accounts recivable 56 442 67 546 67 318 65 905 66 554 68 628<br />
Liabilities 1 266 624 1 326 746 1 413 578 1 449 462 1 403 464 1 414 235<br />
Currency and deposits 610 751 609 149 644 485 656 061 634 516 645 098<br />
Securities other than shares 178 823 203 200 241 217 257 935 225 290 199 412<br />
Loans 255 376 271 379 248 076 244 261 241 145 249 087<br />
Shares and other equity 22 322 22 341 34 616 33 426 23 992 28 945<br />
Insurance technical reserves 129 948 170 651 193 113 212 970 231 327 249 097<br />
Other accounts payable 69 404 50 026 52 071 44 809 47 194 42 596<br />
Net worth, financial 59 582 67 258 59 755 45 449 56 456 67 557<br />
Table 19.2 Financial corporations. Changes in financial balance sheet. Million kroner<br />
1 988 1 989 1 990 1 991 1 992 1 993<br />
Changes in financial assets 67 798 79 329 21 578 -34 991 21 872 88 757<br />
Monetary gold and SDRs 213 -544 -742 29 -296 1 561<br />
Currency and deposits -7 985 -11 578 8 068 23 885 -2 466 -34 453<br />
Securities other than shares -13 622 48 936 -3 351 -15 014 38 233 108 631<br />
Loans 74 818 34 295 17 910 -45 126 -12 584 -3 006<br />
Shares and other equity 3 270 8 448 1 106 586 -3089 12 619<br />
Insurance technical reserves - -<br />
Other accounts recivable 11 104 - 228 -1 413 649 2 074 3 405<br />
Changes in liabilities 60 122 86 832 35 884 -45 998 10 771 79 420<br />
Currency and deposits -1 602 35 336 11 576 -21 545 10 582 22 560<br />
Securities other than shares 24 377 38 017 16 718 -32 645 -25 878 28 969<br />
Loans 16 003 -23303 -3815 -3 116 7 942 -24045<br />
Shares and other equity 19 12 275 -1 190 -9434 4 953 18 339<br />
Insurance technical reserves 40 703 22 462 19 857 18 357 17 770 29 846<br />
Other accounts payable -19 378 2 045 -7 262 2 385 -4 598 3 751<br />
Changes in net worth, financial<br />
Net lending/borrowing<br />
Other changes in volum of assets<br />
Nominal holding gains/losses 1<br />
Statistical disturbences/Other changes<br />
7 676<br />
7 984<br />
-11 217<br />
-2 388<br />
-9 137<br />
-7 503<br />
8 603<br />
-10 164<br />
-5 260<br />
-21 010<br />
-14306<br />
6 006<br />
-14 543<br />
3 059<br />
-37 914<br />
11 007<br />
11 193<br />
-17496<br />
-1 973<br />
-15 709<br />
11 101 9 337<br />
13 400 13 661<br />
-11 537 -3507<br />
-3497 -27 156<br />
-10339 19 325<br />
1 The difference between market value and book value is included in nominal holding gains/losses.<br />
48


