

National Accounts 1988-1993. Institutional Sector Accounts
National Accounts 1988-1993. Institutional Sector Accounts
National Accounts 1988-1993. Institutional Sector Accounts

You also want an ePaper? Increase the reach of your titles
YUMPU automatically turns print PDFs into web optimized ePapers that Google loves.
<strong>National</strong> <strong>Accounts</strong> <strong>1988</strong>-1993<br />
Official Statistics of Norway<br />
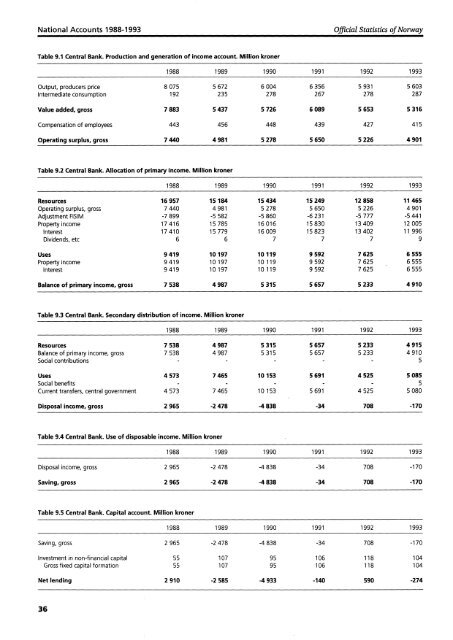
Table 9.1 Central Bank. Production and generation of income account. Million kroner<br />
<strong>1988</strong> 1989 1990 1991 1992 1993<br />
Output, producers price 8 075 5 672 6 004 6 356 5 931 5 603<br />
Intermediate consumption 192 235 278 267 278 287<br />
Value added, gross 7 883 5 437 5 726 6 089 5 653 5 316<br />
Compensation of employees 443 456 448 439 427 415<br />
Operating surplus, gross 7 440 4 981 5 278 5 650 5 226 4 901<br />
Table 9.2 Central Bank. Allocation of primary income. Million kroner<br />
<strong>1988</strong> 1989 1990 1991 1992 1993<br />
Resources 16 957 15 184 15 434 15 249 12 858 11 465<br />
Operating surplus, gross 7 440 4 981 5 278 5 650 5 226 4 901<br />
Adjustment FISIM -7 899 -5 582 -5 860 -6 231 -5 777 -5 441<br />
Property income 17 416 15 785 16 016 15 830 13 409 12 005<br />
Interest 17 410 15 779 16 009 15 823 13 402 11 996<br />
Dividends, etc 6 6 7 7 7 9<br />
Uses 9 419 10 197 10 119 9 592 7 625 6 555<br />
Property income 9 419 10 197 10 119 9 592 7 625 6 555<br />
Interest 9 419 10 197 10 119 9 592 7 625 6 555<br />
Balance of primary income, gross 7 538 4 987 5 315 5 657 5 233 4 910<br />
Table 9.3 Central Bank. Secondary distribution of income. Million kroner<br />
<strong>1988</strong> 1989 1990 1991 1992 1993<br />
Resources 7 538 4 987 5 315 5 657 5 233 4 915<br />
Balance of primary income, gross 7 538 4 987 5 315 5 657 5 233 4 910<br />
Social contributions - 5<br />
Uses 4 573 7 465 10 153 5 691 4 525 5 085<br />
Social benefits - - 5<br />
Current transfers, central government 4 573 7 465 10 153 5 691 4 525 5 080<br />
Disposal income, gross 2 965 -2 478 -4 838 -34 708 -170<br />
Table 9.4 Central Bank. Use of disposable income. Million kroner<br />
<strong>1988</strong> 1989 1990 1991 1992 1993<br />
Disposal income, gross 2 965 -2 478 -4 838 -34 708 -170<br />
Saving, gross 2 965 -2 478 -4 838 -34 708 -170<br />
Table 9.5 Central Bank. Capital account. Million kroner<br />
<strong>1988</strong> 1989 1990 1991 1992 1993<br />
Saving, gross 2 965 -2478 -4838 -34 708 -170<br />
Investment in non-financial capital 55 107 95 106 118 104<br />
Gross fixed capital formation 55 107 95 106 118 104<br />
Net lending 2 910 -2 585 -4 933 -140 590 -274<br />
36


