

National Accounts 1988-1993. Institutional Sector Accounts
National Accounts 1988-1993. Institutional Sector Accounts
National Accounts 1988-1993. Institutional Sector Accounts

You also want an ePaper? Increase the reach of your titles
YUMPU automatically turns print PDFs into web optimized ePapers that Google loves.
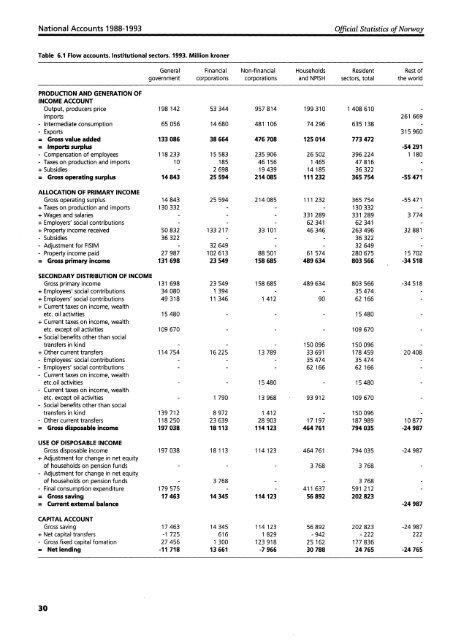
<strong>National</strong> <strong>Accounts</strong> <strong>1988</strong>-1993<br />
Official Statistics of Norway<br />
Table 6.1 Flow accounts. <strong>Institutional</strong> sectors. <strong>1993.</strong> Million kroner<br />
General Financial Non-financial Households Resident Rest of<br />
government corporations corporations and NPISH sectors, total the world<br />
PRODUCTION AND GENERATION OF<br />
INCOME ACCOUNT<br />
Output, producers price 198 142 53 344 957 814 199 310 1 408 610<br />
Imports 261 669<br />
- Intermediate consumption 65 056 14 680 481 106 74 296 635 138<br />
- Exports 315 960<br />
= Gross value added 133 086 38 664 476 708 125 014 773 472<br />
= Imports surplus -54 291<br />
- Compensation of employees 118 233 15 583 235 906 26 502 396 224 1 180<br />
- Taxes on production and imports 10 185 46 156 1 465 47 816<br />
+ Subsidies 2 698 19 439 14 185 36 322<br />
= Gross operating surplus 14 843 25 594 214 085 111 232 365 754 -55471<br />
ALLOCATION OF PRIMARY INCOME<br />
Gross operating surplus 14 843 25 594 214 085 111 232 365 754 -55471<br />
+ Taxes on production and imports 130 332 130 332<br />
+ Wages and salaries 331 289 331 289 3 774<br />
+ Employers' social contributions 62 341 62 341 -<br />
+ Property income received 50 832 133 217 33 101 46 346 263 496 32 881<br />
- Subsidies 36 322 36 322<br />
- Adjustment for FISIM 32 649 32 649<br />
- Property income paid 27 987 102 613 88 501 61 574 280 675 15 702<br />
= Gross primary income 131 698 23 549 158 685 489 634 803 566 -34 518<br />
SECONDARY DISTRIBUTION OF INCOME<br />
Gross primary income 131 698 23 549 158 685 489 634 803 566 -34 518<br />
+ Employees' social contributions 34 080 1 394 35 474<br />
+ Employers' social contributions 49 318 11 346 1 412 90 62 166<br />
+ Current taxes on income, wealth<br />
etc. oil activities 15 480 15 480<br />
+ Current taxes on income, wealth<br />
etc. except oil activities 109 670 109 670<br />
+ Social benefits other than social<br />
transfers in kind 150 096 150 096<br />
+ Other current transfers 114 754 16 225 13 789 33 691 178 459 20 408<br />
- Employees' social contributions 35 474 35 474<br />
- Employers' social contributions 62 166 62 166<br />
- Current taxes on income, wealth<br />
etc.oil activities 15 480 15 480<br />
- Current taxes on income, wealth<br />
etc. except oil activities 1 790 13 968 93 912 109 670<br />
- Social benefits other than social<br />
transfers in kind 139 712 8 972 1 412 150 096<br />
- Other current transfers 118 250 23 639 28 903 17 197 187 989 10 877<br />
= Gross disposable income 197 038 18 113 114 123 464 761 794 035 -24987<br />
USE OF DISPOSABLE INCOME<br />
Gross disposable income 197 038 18 113 114 123 464 761 794 035 -24987<br />
+ Adjustment for change in net equity<br />
of households on pension funds 3 768 3 768<br />
- Adjustment for change in net equity<br />
of households on pension funds 3 768 - 3 768<br />
- Final consumption expenditure 179 575 411 637 591 212<br />
= Gross saving 17 463 14 345 114 123 56 892 202 823<br />
= Current external balance -24 987<br />
CAPITAL ACCOUNT<br />
Gross saving 17 463 14 345 114 123 56 892 202 823 -24987<br />
+ Net capital transfers -1 725 616 1 829 -942 -222 222<br />
- Gross fixed capital fomation 27 456 1 300 123 918 25 162 177 836<br />
= Net lending -11718 13 661 -7966 30 788 24 765 -24765<br />
30


