

National Accounts 1988-1993. Institutional Sector Accounts
National Accounts 1988-1993. Institutional Sector Accounts
National Accounts 1988-1993. Institutional Sector Accounts

You also want an ePaper? Increase the reach of your titles
YUMPU automatically turns print PDFs into web optimized ePapers that Google loves.
<strong>National</strong> <strong>Accounts</strong> <strong>1988</strong>-1993<br />
Official Statistics of Norway<br />
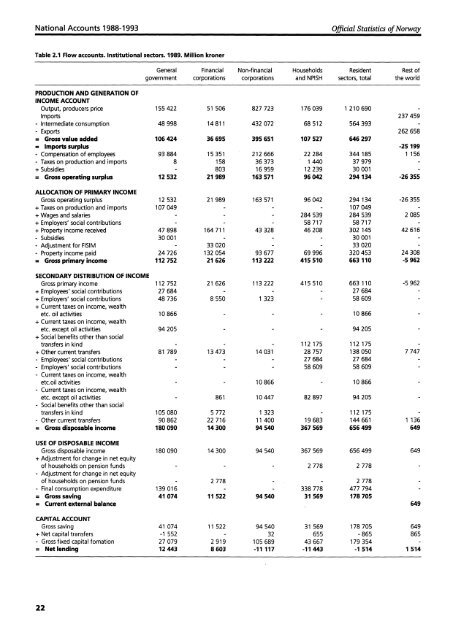
Table 2.1 Flow accounts. <strong>Institutional</strong> sectors. 1989. Million kroner<br />
General Financial Non-financial Households Resident Rest of<br />
government corporations corporations and NPISH sectors, total the world<br />
PRODUCTION AND GENERATION OF<br />
INCOME ACCOUNT<br />
Output, producers price 155 422 51 506 827 723 176 039 1 210 690<br />
Imports 237 459<br />
- Intermediate consumption 48 998 14 811 432 072 68 512 564 393 -<br />
- Exports 262 658<br />
= Gross value added 106 424 36 695 395 651 107 527 646 297<br />
= Imports surplus -25 199<br />
- Compensation of employees 93 884 15 351 212 666 22 284 344 185 1 156<br />
- Taxes on production and imports 8 158 36 373 1 440 37 979 -<br />
+ Subsidies 803 16 959 12 239 30 001<br />
= Gross operating surplus 12 532 21 989 163 571 96 042 294 134 -26 355<br />
ALLOCATION OF PRIMARY INCOME<br />
Gross operating surplus 12 532 21 989 163 571 96 042 294 134 -26355<br />
+ Taxes on production and imports 107 049 107 049<br />
+ Wages and salaries 284 539 284 539 2 085<br />
+ Employers' social contributions 58 717 58 717<br />
+ Property income received 47 898 164 711 43 328 46 208 302 145 42 616<br />
- Subsidies 30 001 - 30 001<br />
- Adjustment for FISIM 33 020 33 020<br />
- Property income paid 24 726 132 054 93 677 69 996 320 453 24 308<br />
= Gross primary income 112 752 21 626 113 222 415 510 663 110 -5 962<br />
SECONDARY DISTRIBUTION OF INCOME<br />
Gross primary income 112 752 21 626 113 222 415 510 663 110 -5962<br />
+ Employees' social contributions 27 684 27 684<br />
+ Employers' social contributions 48 736 8 550 1 323 58 609<br />
+ Current taxes on income, wealth<br />
etc. oil activities 10 866 10 866<br />
+ Current taxes on income, wealth<br />
etc. except oil activities 94 205 94 205<br />
+ Social benefits other than social<br />
transfers in kind 112 175 112 175<br />
+ Other current transfers 81 789 13 473 14 031 28 757 138 050 7 747<br />
- Employees' social contributions 27 684 27 684<br />
- Employers' social contributions 58 609 58 609<br />
- Current taxes on income, wealth<br />
etc.oil activities 10 866 10 866<br />
- Current taxes on income, wealth<br />
etc. except oil activities 861 10 447 82 897 94 205<br />
- Social benefits other than social<br />
transfers in kind 105 080 5 772 1 323 112 175<br />
- Other current transfers 90 862 22 716 11 400 19 683 144 661 1 136<br />
= Gross disposable income 180 090 14 300 94 540 367 569 656 499 649<br />
USE OF DISPOSABLE INCOME<br />
Gross disposable income 180 090 14 300 94 540 367 569 656 499 649<br />
+ Adjustment for change in net equity<br />
of households on pension funds 2 778 2 778<br />
- Adjustment for change in net equity<br />
of households on pension funds - 2 778 - 2 778<br />
- Final consumption expenditure 139 016 338 778 477 794<br />
= Gross saving 41 074 11 522 94 540 31 569 178 705<br />
= Current external balance 649<br />
CAPITAL ACCOUNT<br />
Gross saving 41 074 11 522 94 540 31 569 178 705 649<br />
+ Net capital transfers -1 552 32 655 -865 865<br />
- Gross fixed capital fomation 27 079 2 919 105 689 43 667 179 354<br />
= Net lending 12 443 8 603 -11117 -11443 -1514 1 514<br />
22


