

National Accounts 1988-1993. Institutional Sector Accounts
National Accounts 1988-1993. Institutional Sector Accounts
National Accounts 1988-1993. Institutional Sector Accounts

Create successful ePaper yourself
Turn your PDF publications into a flip-book with our unique Google optimized e-Paper software.
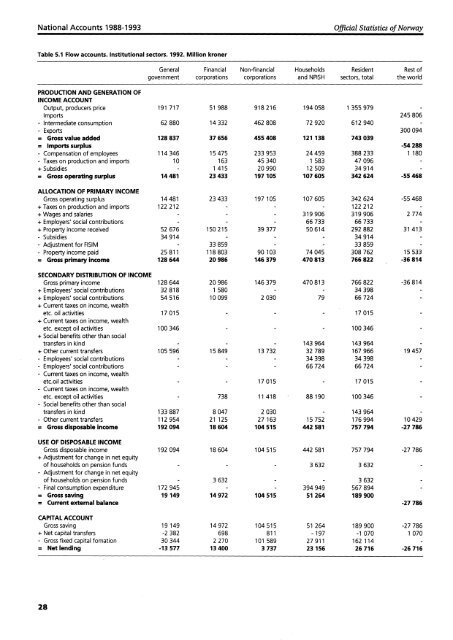
<strong>National</strong> <strong>Accounts</strong> <strong>1988</strong>-1993<br />
Official Statistics of Norway<br />
Table 5.1 Flow accounts. <strong>Institutional</strong> sectors. 1992. Million kroner<br />
General Financial Non-financial Households Resident Rest of<br />
government corporations corporations and NPISH sectors, total the world<br />
PRODUCTION AND GENERATION OF<br />
INCOME ACCOUNT<br />
Output, producers price 191 717 51 988 918 216 194 058 1 355 979<br />
Imports 245 806<br />
- Intermediate consumption 62 880 14 332 462 808 72 920 612 940<br />
- Exports 300 094<br />
= Gross value added 128 837 37 656 455 408 121 138 743 039<br />
= Imports surplus -54 288<br />
- Compensation of employees 114 346 15 475 233 953 24 459 388 233 1 180<br />
- Taxes on production and imports 10 163 45 340 1 583 47 096<br />
+ Subsidies 1 415 20 990 12 509 34 914<br />
= Gross operating surplus 14 481 23 433 197 105 107 605 342 624 -55468<br />
ALLOCATION OF PRIMARY INCOME<br />
Gross operating surplus 14 481 23 433 197 105 107 605 342 624 -55 468<br />
+ Taxes on production and imports 122 212 122 212<br />
+ Wages and salaries - 319 906 319 906 2 774<br />
+ Employers' social contributions 66 733 66 733 -<br />
+ Property income received 52 676 150 215 39 377 50 614 292 882 31 413<br />
- Subsidies 34 914 - 34 914<br />
- Adjustment for FISIM 33 859 - 33 859<br />
- Property income paid 25 811 118 803 90 103 74 045 308 762 15 533<br />
= Gross primary income 128 644 20 986 146 379 470 813 766 822 -36814<br />
SECONDARY DISTRIBUTION OF INCOME<br />
Gross primary income 128 644 20 986 146 379 470 813 766 822 -36814<br />
+ Employees' social contributions 32 818 1 580 34 398<br />
+ Employers' social contributions 54 516 10 099 2 030 79 66 724<br />
+ Current taxes on income, wealth<br />
etc. oil activities 17 015 - 17 015<br />
+ Current taxes on income, wealth<br />
etc. except oil activities 100 346 100 346<br />
+ Social benefits other than social<br />
transfers in kind 143 964 143 964<br />
+ Other current transfers 105 596 15 849 13 732 32 789 167 966 19 457<br />
- Employees' social contributions 34 398 34 398<br />
- Employers' social contributions - 66 724 66 724<br />
- Current taxes on income, wealth<br />
etc.oil activities - 17 015 17 015<br />
- Current taxes on income, wealth<br />
etc. except oil activities 738 11 418 88 190 100 346<br />
- Social benefits other than social<br />
transfers in kind 133 887 8 047 2 030 143 964<br />
- Other current transfers 112 954 21 125 27 163 15 752 176 994 10 429<br />
= Gross disposable income 192 094 18 604 104 515 442 581 757 794 -27 786<br />
USE OF DISPOSABLE INCOME<br />
Gross disposable income 192 094 18 604 104 515 442 581 757 794 -27786<br />
+ Adjustment for change in net equity<br />
of households on pension funds 3 632 3 632<br />
- Adjustment for change in net equity<br />
of households on pension funds 3 632 - 3 632 -<br />
- Final consumption expenditure 172 945 394 949 567 894<br />
= Gross saving 19 149 14 972 104 515 51 264 189 900<br />
= Current external balance -27 786<br />
CAPITAL ACCOUNT<br />
Gross saving 19 149 14 972 104 515 51 264 189 900 -27786<br />
+ Net capital transfers -2 382 698 811 - 197 -1 070 1 070<br />
- Gross fixed capital fomation 30 344 2 270 101 589 27 911 162 114<br />
= Net lending -13577 13 400 3 737 23 156 26 716 -26716<br />
28


