

National Accounts 1988-1993. Institutional Sector Accounts
National Accounts 1988-1993. Institutional Sector Accounts
National Accounts 1988-1993. Institutional Sector Accounts

Create successful ePaper yourself
Turn your PDF publications into a flip-book with our unique Google optimized e-Paper software.
<strong>National</strong> <strong>Accounts</strong> <strong>1988</strong>-1993<br />
Official Statistics of Norway<br />
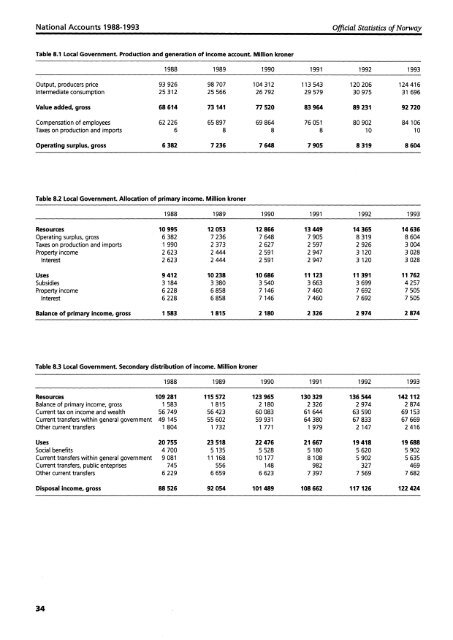
Table 8.1 Local Government. Production and generation of income account. Million kroner<br />
<strong>1988</strong> 1989 1990 1991 1992 1993<br />
93 Output, producers 926 price<br />
98 707 104 312 113 543 120 206 124 416<br />
Intermediate consumption<br />
25 312 25 566 26 792 29 579 30 975 31 696<br />
68 Value added, gross 614 73 141 77 520 83 964 89 231 92 720<br />
62 Compensation of 226 employees<br />
65 897 69 864 76 051 80 902 84 106<br />
Taxes on production and imports<br />
6 8 8 8 10 10<br />
6 Operating 382 surplus, gross<br />
7 236 7 648 7 905 8 319 8 604<br />
Table 8.2 Local Government. Allocation of primary income. Million kroner<br />
<strong>1988</strong> 1989 1990 1991 1992 1993<br />
Resources 10 995 12 053 12 866 13 449 14 365 14 636<br />
Operating surplus, gross 6 382 7 236 7 648 7 905 8 319 8 604<br />
Taxes on production and imports 1 990 2 373 2 627 2 597 2 926 3 004<br />
Property income 2 623 2 444 2 591 2 947 3 120 3 028<br />
Interest 2 623 2 444 2 591 2 947 3 120 3 028<br />
Uses 9 412 10 238 10 686 11 123 11 391 11 762<br />
Subsidies 3 184 3 380 3 540 3 663 3 699 4 257<br />
Property income 6 228 6 858 7 146 7 460 7 692 7 505<br />
Interest 6 228 6 858 7 146 7 460 7 692 7 505<br />
Balance of primary income, gross 1 583 1 815 2 180 2 326 2 974 2 874<br />
Table 8.3 Local Government. Secondary distribution of income. Million kroner<br />
<strong>1988</strong> 1989 1990 1991 1992 1993<br />
Resources 109 281 115 572 123 965 130 329 136 544 142 112<br />
Balance of primary income, gross 1 583 1 815 2 180 2 326 2 974 2 874<br />
Current tax on income and wealth 56 749 56 423 60 083 61 644 63 590 69 153<br />
Current transfers within general government 49 145 55 602 59 931 64 380 67 833 67 669<br />
Other current transfers 1 804 1 732 1 771 1 979 2 147 2 416<br />
Uses 20 755 23 518 22 476 21 667 19 418 19 688<br />
Social benefits 4 700 5 135 5 528 5 180 5 620 5 902<br />
Current transfers within general government 9 081 11 168 10 177 8 108 5 902 5 635<br />
Current transfers, public enteprises 745 556 148 982 327 469<br />
Other current transfers 6 229 6 659 6 623 7 397 7 569 7 682<br />
Disposal income, gross 88 526 92 054 101 489 108 662 117 126 122 424<br />
34


