

National Accounts 1988-1993. Institutional Sector Accounts
National Accounts 1988-1993. Institutional Sector Accounts
National Accounts 1988-1993. Institutional Sector Accounts

Create successful ePaper yourself
Turn your PDF publications into a flip-book with our unique Google optimized e-Paper software.
<strong>National</strong> <strong>Accounts</strong> <strong>1988</strong>-1993<br />
Official Statistics of Norway<br />
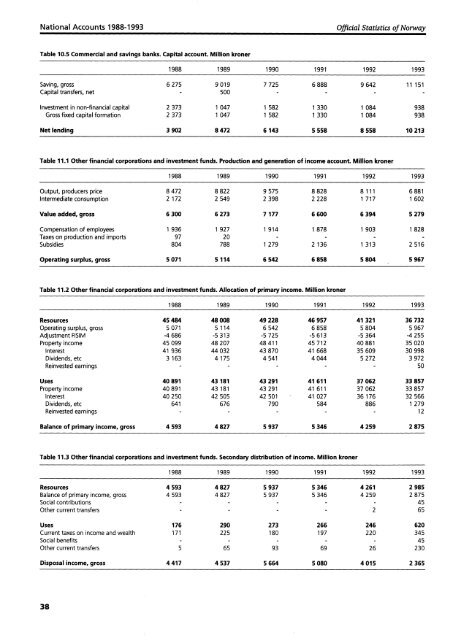
Table 10.5 Commercial and savings banks. Capital account. Million kroner<br />
<strong>1988</strong> 1989 1990 1991 1992 1993<br />
Saving, gross 6 275 9 019 7 725 6 888 9 642 11 151<br />
Capital transfers, net 500<br />
Investment in non-financial capital 2 373 1 047 1 582 1 330 1 084 938<br />
Gross fixed capital formation 2 373 1 047 1 582 1 330 1 084 938<br />
Net lending 3 902 8 472 6 143 5 558 8 558 10 213<br />
Table 11.1 Other financial corporations and investment funds. Production and generation of income account. Million kroner<br />
<strong>1988</strong> 1989 1990 1991 1992 1993<br />
Output, producers price 8 472 8 822 9 575 8 828 8 111 6 881<br />
Intermediate consumption 2 172 2 549 2 398 2 228 1 717 1 602<br />
Value added, gross 6 300 6 273 7 177 6 600 6 394 5 279<br />
Compensation of employees 1 936 1 927 1 914 1 878 1 903 1 828<br />
Taxes on production and imports 97 20<br />
Subsidies 804 788 1 279 2 136 1 313 2 516<br />
Operating surplus, gross 5 071 5 114 6 542 6 858 5 804 5 967<br />
Table 11.2 Other financial corporations and investment funds. Allocation of primary income. Million kroner<br />
<strong>1988</strong> 1989 1990 1991 1992 1993<br />
Resources 45 484 48 008 49 228 46 957 41 321 36 732<br />
Operating surplus, gross 5 071 5 114 6 542 6 858 5 804 5 967<br />
Adjustment FISIM -4686 -5313 -5725 -5613 -5364 -4255<br />
Property income 45 099 48 207 48 411 45 712 40 881 35 020<br />
Interest 41 936 44 032 43 870 41 668 35 609 30 998<br />
Dividends, etc 3 163 4 175 4 541 4 044 5 272 3 972<br />
Reinvested earnings - 50<br />
Uses 40 891 43 181 43 291 41 611 37 062 33 857<br />
Property income 40 891 43 181 43 291 41 611 37 062 33 857<br />
Interest 40 250 42 505 42 501 41 027 36 176 32 566<br />
Dividends, etc 641 676 790 584 886 1 279<br />
Reinvested earnings 12<br />
Balance of primary income, gross 4 593 4 827 5 937 5 346 4 259 2 875<br />
Table 11.3 Other financial corporations and investment funds. Secondary distribution of income. Million kroner<br />
<strong>1988</strong> 1989 1990 1991 1992 1993<br />
Resources 4 593 4 827 5 937 5 346 4 261 2 985<br />
Balance of primary income, gross 4 593 4 827 5 937 5 346 4 259 2 875<br />
Social contributions 45<br />
Other current transfers 2 65<br />
Uses 176 290 273 266 246 620<br />
Current taxes on income and wealth 171 225 180 197 220 345<br />
Social benefits 45<br />
Other current transfers 5 65 93 69 26 230<br />
Disposal income, gross 4 417 4 537 5 664 5 080 4 015 2 365<br />
38


