

National Accounts 1988-1993. Institutional Sector Accounts
National Accounts 1988-1993. Institutional Sector Accounts
National Accounts 1988-1993. Institutional Sector Accounts

You also want an ePaper? Increase the reach of your titles
YUMPU automatically turns print PDFs into web optimized ePapers that Google loves.
<strong>National</strong> <strong>Accounts</strong> <strong>1988</strong>-1993<br />
11=1111111111111■11111111■1111M111.<br />
Official Statistics of Norway<br />
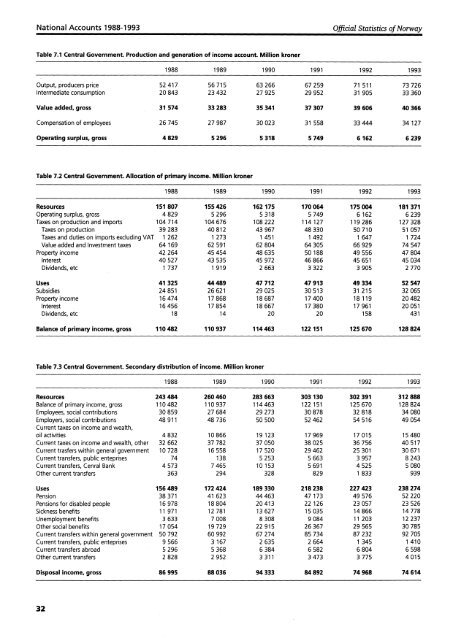
Table 7.1 Central Government. Production and generation of income account. Million kroner<br />
<strong>1988</strong> 1989 1990 1991 1992 1993<br />
Output, producers price 52 417 56 715 63 266 67 259 71 511 73 726<br />
Intermediate consumption 20 843 23 432 27 925 29 952 31 905 33 360<br />
Value added, gross 31 574 33 283 35 341 37 307 39 606 40 366<br />
Compensation of employees 26 745 27 987 30 023 31 558 33 444 34 127<br />
Operating surplus, gross 4 829 5 296 5 318 5 749 6 162 6 239<br />
Table 7.2 Central Government. Allocation of primary income. Million kroner<br />
<strong>1988</strong> 1989 1990 1991 1992 1993<br />
Resources 151 807 155 426 162 175 170 064 175 004 181 371<br />
Operating surplus, gross 4 829 5 296 5 318 5 749 6 162 6 239<br />
Taxes on production and imports 104 714 104 676 108 222 114 127 119 286 127 328<br />
Taxes on production 39 283 40 812 43 967 48 330 50 710 51 057<br />
Taxes and duties on imports excluding VAT 1 262 1 273 1 451 1 492 1 647 1 724<br />
Value added and Investment taxes 64 169 62 591 62 804 64 305 66 929 74 547<br />
Property income 42 264 45 454 48 635 50 188 49 556 47 804<br />
Interest 40 527 43 535 45 972 46 866 45 651 45 034<br />
Dividends, etc 1 737 1 919 2 663 3 322 3 905 2 770<br />
Uses 41 325 44 489 47 712 47 913 49 334 52 547<br />
Subsidies 24 851 26 621 29 025 30 513 31 215 32 065<br />
Property income 16 474 17 868 18 687 17 400 18 119 20 482<br />
Interest 16 456 17 854 18 667 17 380 17 961 20 051<br />
Dividends, etc 18 14 20 20 158 431<br />
Balance of primary income, gross 110 482 110 937 114 463 122 151 125 670 128 824<br />
Table 7.3 Central Government. Secondary distribution of income. Million kroner<br />
<strong>1988</strong> 1989 1990 1991 1992 1993<br />
Resources 243 484 260 460 283 663 303 130 302 391 312 888<br />
Balance of primary income, gross 110 482 110 937 114 463 122 151 125 670 128 824<br />
Employees, social contributions 30 859 27 684 29 273 30 878 32 818 34 080<br />
Employers, social contributions 48 911 48 736 50 500 52 462 54 516 49 054<br />
Current taxes on income and wealth,<br />
oil activities 4 832 10 866 19 123 17 969 17 015 15 480<br />
Current taxes on income and wealth, other 32 662 37 782 37 050 38 025 36 756 40 517<br />
Current trasfers within general government 10 728 16 558 17 520 29 462 25 301 30 671<br />
Current transfers, public enteprises 74 138 5 253 5 663 3 957 8 243<br />
Current transfers, Cenral Bank 4 573 7 465 10 153 5 691 4 525 5 080<br />
Other current transfers 363 294 328 829 1 833 939<br />
Uses 156 489 172 424 189 330 218 238 227 423 238 274<br />
Pension 38 371 41 623 44 463 47 173 49 576 52 220<br />
Pensions for disabled people 16 978 18 804 20 413 22 126 23 057 23 526<br />
Sickness benefits 11 971 12 781 13 627 15 035 14 866 14 778<br />
Unemployment benefits 3 633 7 008 8 308 9 084 11 203 12 237<br />
Other social benefits 17 054 19 729 22 915 26 367 29 565 30 785<br />
Current transfers within general government 50 792 60 992 67 274 85 734 87 232 92 705<br />
Current transfers, public enteprises 9 566 3 167 2 635 2 664 1 345 1 410<br />
Current transfers abroad 5 296 5 368 6 384 6 582 6 804 6 598<br />
Other current transfers 2 828 2 952 3 311 3 473 3 775 4 015<br />
Disposal income, gross 86 995 88 036 94 333 84 892 74 968 74 614<br />
32


