

National Accounts 1988-1993. Institutional Sector Accounts
National Accounts 1988-1993. Institutional Sector Accounts
National Accounts 1988-1993. Institutional Sector Accounts

You also want an ePaper? Increase the reach of your titles
YUMPU automatically turns print PDFs into web optimized ePapers that Google loves.
<strong>National</strong> <strong>Accounts</strong> <strong>1988</strong>-1993<br />
Official Statistics of Norway<br />
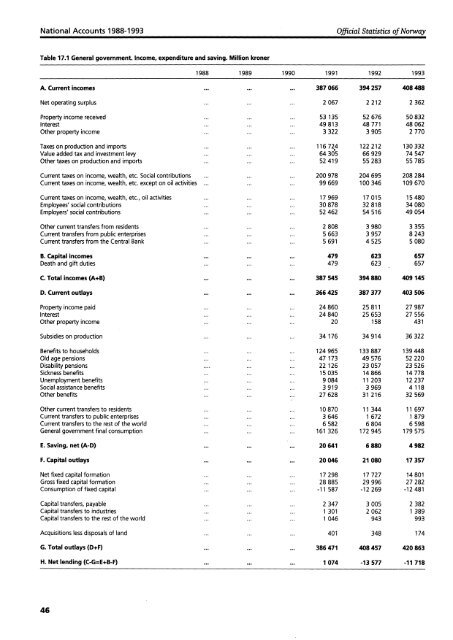
Table 17.1 General government. Income, expenditure and saving. Million kroner<br />
<strong>1988</strong> 1989 1990 1991 1992 1993<br />
A. Current incomes ••• ••• ••• 387 066 394 257 408 488<br />
Net operating surplus ••• ••• 2 067 2 212 2 362<br />
Property income received ••. ... 53 135 52 676 50 832<br />
Interest .. ••• •• 49 813 48 771 48 062<br />
Other property income .. ••• 3 322 3 905 2 770<br />
Taxes on production and imports<br />
Value added tax and investment levy<br />
Other taxes on production and imports<br />
••• ••• •••<br />
•••<br />
••<br />
•••<br />
116 724<br />
64 305<br />
52 419<br />
122 212 130 332<br />
66 929 74 547<br />
55 283 55 785<br />
Current taxes on income, wealth, etc. Social contributions •• ••• 200 978 204 695 208 284<br />
Current taxes on income, wealth, etc. except on oil activities • • ••• 99 669 100 346 109 670<br />
Current taxes on income, wealth, etc., oil activities •• ••• 17 969 17 015 15 480<br />
Employees' social contributions 30 878 32 818 34 080<br />
Employers' social contributions ••• ••• 52 462 54 516 49 054<br />
Other current transfers from residents ••• ••• 2 808 3 980 3 355<br />
Current transfers from public enterprises •• 5 663 3 957 8 243<br />
Current transfers from the Central Bank 5 691 4 525 5 080<br />
B.Capital incomes<br />
Death and gift duties<br />
C. Total incomes (A+B)<br />
D. Current outlays<br />
••• •••<br />
•••<br />
••• •••<br />
••• 479 623 657<br />
••• 479 623 • 657<br />
••• 387 545 394 880 409 145<br />
366 425 387 377 403 506<br />
Property income paid ... ••• 24 860 25 811 27 987<br />
Interest ••• ••• 24 840 25 653 27 556<br />
Other property income ... ••• 20 158 431<br />
Subsidies on production ••• 34 176 34 914 36 322<br />
Benefits to households<br />
Old age pensions<br />
Disability pensions<br />
Sickness benefits<br />
Unemployment benefits<br />
Social assistance benefits<br />
Other benefits<br />
•••<br />
•••<br />
•••<br />
•• •• ••• •••<br />
•••<br />
•••<br />
•••<br />
•••<br />
•••<br />
•••<br />
•••<br />
124 965<br />
47 173<br />
22 126<br />
15 035<br />
9 084<br />
3 919<br />
27 628<br />
133 887 139 448<br />
49 576 52 220<br />
23 057 23 526<br />
14 866 14 778<br />
11 203 12 237<br />
3 969 4 118<br />
31 216 32 569<br />
Other current transfers to residents<br />
Current transfers to public enterprises<br />
Current transfers to the rest of the world<br />
General government final consumption<br />
•• 10 870 11 344 11 697<br />
•• ••• 3 646 1 672 1 879<br />
•• ••• 6 582 6 804 6 598<br />
••• ••• 161 326 172 945 179 575<br />
E. Saving, net (A-D) ••• ••• ••• 20 641 6 880 4 982<br />
F.Capital outlays ••• ••• ••• 20 046 21 080 17 357<br />
Net fixed capital formation .. ... 17 298 17 727 14 801<br />
Gross fixed capital formation •• 28 885 29 996 27 282<br />
Consumption of fixed capital ••• -11 587 -12 269 -12 481<br />
Capital transfers, payable ••• 2 347 3 005 2 382<br />
Capital transfers to industries . 1 301 2 062 1 389<br />
Capital transfers to the rest of the world ••• 1 046 943 993<br />
Acquisitions less disposals of land ••• 401 348 174<br />
G. Total outlays (D+F) ••• ••• ••• 386 471 408 457 420 863<br />
H. Net lending (C-G=E+B-F) ••• ••• ••• 1 074 -13 577 -11 718<br />
46


