- Page 1 and 2:
CHEMIA 4/2010
- Page 3 and 4:
L.M. PĂCUREANU, A. BORA, L. CRIŞA
- Page 5 and 6:
Studia Universitatis Babes-Bolyai C
- Page 7 and 8:
MIRCEA V. DIUDEA theorem in multi-s
- Page 9 and 10:
MIRCEA V. DIUDEA 4. M.V. Diudea, Cs
- Page 12 and 13:
STUDIA UBB. CHEMIA, LV, 4, 2010 DIA
- Page 14 and 15:
DIAMOND D 5 , A NOVEL ALLOTROPE OF
- Page 16 and 17:
DIAMOND D 5 , A NOVEL ALLOTROPE OF
- Page 18:
DIAMOND D 5 , A NOVEL ALLOTROPE OF
- Page 21 and 22:
MONICA L. POP, MIRCEA V. DIUDEA AND
- Page 23 and 24:
MONICA L. POP, MIRCEA V. DIUDEA AND
- Page 25 and 26:
MONICA L. POP, MIRCEA V. DIUDEA AND
- Page 28 and 29:
STUDIA UBB. CHEMIA, LV, 4, 2010 EVA
- Page 30 and 31:
EVALUATION OF THE ANTIOXIDANT CAPAC
- Page 32 and 33:
EVALUATION OF THE ANTIOXIDANT CAPAC
- Page 34 and 35:
EVALUATION OF THE ANTIOXIDANT CAPAC
- Page 36 and 37:
STUDIA UBB. CHEMIA, LV, 4, 2010 TO
- Page 38 and 39:
TO WHAT EXTENT THE NMR “MOBILE PR
- Page 40 and 41:
TO WHAT EXTENT THE NMR “MOBILE PR
- Page 42 and 43:
TO WHAT EXTENT THE NMR “MOBILE PR
- Page 44 and 45:
TO WHAT EXTENT THE NMR “MOBILE PR
- Page 46 and 47:
TO WHAT EXTENT THE NMR “MOBILE PR
- Page 48 and 49:
TO WHAT EXTENT THE NMR “MOBILE PR
- Page 50 and 51:
TO WHAT EXTENT THE NMR “MOBILE PR
- Page 52 and 53:
TO WHAT EXTENT THE NMR “MOBILE PR
- Page 54 and 55:
TO WHAT EXTENT THE NMR “MOBILE PR
- Page 56 and 57:
TO WHAT EXTENT THE NMR “MOBILE PR
- Page 58 and 59:
TO WHAT EXTENT THE NMR “MOBILE PR
- Page 60:
TO WHAT EXTENT THE NMR “MOBILE PR
- Page 63 and 64:
LORENTZ JÄNTSCHI, SORANA D. BOLBOA
- Page 65 and 66:
LORENTZ JÄNTSCHI, SORANA D. BOLBOA
- Page 67 and 68:
LORENTZ JÄNTSCHI, SORANA D. BOLBOA
- Page 70 and 71:
STUDIA UBB. CHEMIA, LV, 4, 2010 DIA
- Page 72 and 73:
DIAGNOSTIC OF A QSPR MODEL: AQUEOUS
- Page 74 and 75:
DIAGNOSTIC OF A QSPR MODEL: AQUEOUS
- Page 76 and 77:
DIAGNOSTIC OF A QSPR MODEL: AQUEOUS
- Page 78 and 79:
STUDIA UBB. CHEMIA, LV, 4, 2010 MOD
- Page 80 and 81:
MODELING THE BIOLOGICAL ACTIVITY OF
- Page 82:
MODELING THE BIOLOGICAL ACTIVITY OF
- Page 85 and 86:
LILIANA M. PĂCUREANU, ALINA BORA,
- Page 87 and 88:
LILIANA M. PĂCUREANU, ALINA BORA,
- Page 89 and 90:
LILIANA M. PĂCUREANU, ALINA BORA,
- Page 91 and 92:
LILIANA M. PĂCUREANU, ALINA BORA,
- Page 93 and 94:
A. R. ASHRAFI, P. NIKZAD, A. BEHMAR
- Page 95 and 96:
A. R. ASHRAFI, P. NIKZAD, A. BEHMAR
- Page 97 and 98:
A. R. ASHRAFI, P. NIKZAD, A. BEHMAR
- Page 99 and 100:
GHOLAM HOSSEIN FATH-TABAR, ALI REZA
- Page 101 and 102:
GHOLAM HOSSEIN FATH-TABAR, ALI REZA
- Page 103 and 104:
MODJTABA GHORBANI symmetric but it
- Page 105 and 106:
MODJTABA GHORBANI group can be comp
- Page 107 and 108:
MODJTABA GHORBANI 10. P.V. Khadikar
- Page 109 and 110:
HOSSEIN SHABANI, ALI REZA ASHRAFI,
- Page 111 and 112:
HOSSEIN SHABANI, ALI REZA ASHRAFI,
- Page 113 and 114: HOSSEIN SHABANI, ALI REZA ASHRAFI,
- Page 115 and 116: MIRCEA V. DIUDEA, CSABA L. NAGY, PE
- Page 117 and 118: MIRCEA V. DIUDEA, CSABA L. NAGY, PE
- Page 119 and 120: MIRCEA V. DIUDEA, CSABA L. NAGY, PE
- Page 121 and 122: MIRCEA V. DIUDEA, CSABA L. NAGY, PE
- Page 123 and 124: MIRCEA V. DIUDEA, CSABA L. NAGY, PE
- Page 126 and 127: STUDIA UBB. CHEMIA, LV, 4, 2010 WIE
- Page 128 and 129: WIENER INDEX OF MICELLE-LIKE CHIRAL
- Page 130 and 131: WIENER INDEX OF MICELLE-LIKE CHIRAL
- Page 132 and 133: STUDIA UBB. CHEMIA, LV, 4, 2010 TUT
- Page 134 and 135: TUTTE POLYNOMIAL OF AN INFINITE CLA
- Page 136: TUTTE POLYNOMIAL OF AN INFINITE CLA
- Page 139 and 140: ALI REZA ASHRAFI, HOSSEIN SHABANI,
- Page 141 and 142: ALI REZA ASHRAFI, HOSSEIN SHABANI,
- Page 143 and 144: ALI REZA ASHRAFI, HOSSEIN SHABANI,
- Page 145 and 146: MOHAMMAD A. IRANMANESH, A. ADAMZADE
- Page 147 and 148: MOHAMMAD A. IRANMANESH, A. ADAMZADE
- Page 149 and 150: RALUCA O. POP, MIHAI MEDELEANU, MIR
- Page 151 and 152: RALUCA O. POP, MIHAI MEDELEANU, MIR
- Page 153 and 154: RALUCA O. POP, MIHAI MEDELEANU, MIR
- Page 155 and 156: MELINDA E. FÜSTÖS, ERIKA TASNÁDI
- Page 157 and 158: MELINDA E. FÜSTÖS, ERIKA TASNÁDI
- Page 159 and 160: MELINDA E. FÜSTÖS, ERIKA TASNÁDI
- Page 162 and 163: STUDIA UBB. CHEMIA, LV, 4, 2010 APP
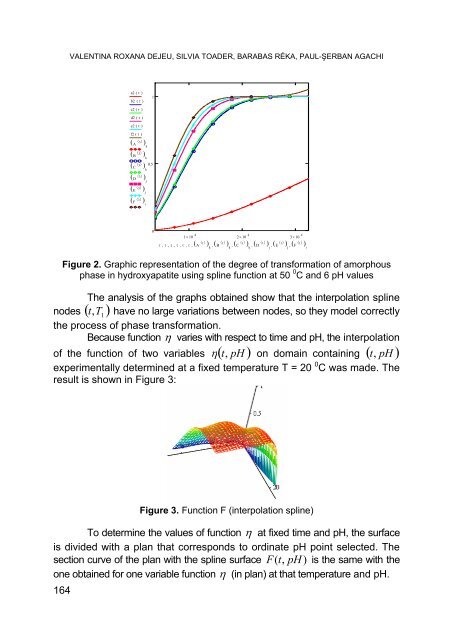
- Page 166: APPLICATION OF NUMERICAL METHODS IN
- Page 169 and 170: VLADIMIR R. ROSENFELD, DOUGLAS J. K
- Page 171 and 172: VLADIMIR R. ROSENFELD, DOUGLAS J. K
- Page 173 and 174: VLADIMIR R. ROSENFELD, DOUGLAS J. K
- Page 175 and 176: VLADIMIR R. ROSENFELD, DOUGLAS J. K
- Page 177 and 178: VLADIMIR R. ROSENFELD, DOUGLAS J. K
- Page 179 and 180: VLADIMIR R. ROSENFELD, DOUGLAS J. K
- Page 181 and 182: VLADIMIR R. ROSENFELD, DOUGLAS J. K
- Page 183 and 184: VLADIMIR R. ROSENFELD, DOUGLAS J. K
- Page 185 and 186: MAHDIEH AZARI, ALI IRANMANESH, ABOL
- Page 187 and 188: MAHDIEH AZARI, ALI IRANMANESH, ABOL
- Page 189 and 190: MAHDIEH AZARI, ALI IRANMANESH, ABOL
- Page 191 and 192: MAHDIEH AZARI, ALI IRANMANESH, ABOL
- Page 193 and 194: MAHDIEH AZARI, ALI IRANMANESH, ABOL
- Page 195 and 196: MAHDIEH AZARI, ALI IRANMANESH, ABOL
- Page 197 and 198: MAHDIEH AZARI, ALI IRANMANESH, ABOL
- Page 199 and 200: MAHSA GHAZI, MODJTABA GHORBANI, KAT
- Page 201 and 202: MAHSA GHAZI, MODJTABA GHORBANI, KAT
- Page 203 and 204: M. GHORBANI, M. A. HOSSEINZADEH, M.
- Page 205 and 206: M. GHORBANI, M. A. HOSSEINZADEH, M.
- Page 207 and 208: M. GHORBANI, M. A. HOSSEINZADEH, M.
- Page 209 and 210: M. GHORBANI, M. A. HOSSEINZADEH, M.
- Page 211 and 212: M. GHORBANI, M. A. HOSSEINZADEH, M.
- Page 213 and 214: MONICA STEFU, VIRGINIA BUCILA, M. V
- Page 215 and 216:
MONICA STEFU, VIRGINIA BUCILA, M. V
- Page 217 and 218:
MAHBOUBEH SAHELI, RALUCA O. POP, MO
- Page 219 and 220:
MAHBOUBEH SAHELI, RALUCA O. POP, MO
- Page 221 and 222:
FARZANEH GHOLAMI-NEZHAAD, MIRCEA V.
- Page 223 and 224:
FARZANEH GHOLAMI-NEZHAAD, MIRCEA V.
- Page 225 and 226:
FARZANEH GHOLAMI-NEZHAAD, MIRCEA V.
- Page 227 and 228:
MAHBOUBEH SAHELI, MIRCEA V. DIUDEA
- Page 229 and 230:
MAHBOUBEH SAHELI, MIRCEA V. DIUDEA
- Page 231 and 232:
MAHBOUBEH SAHELI, MIRCEA V. DIUDEA
- Page 233 and 234:
MAHBOUBEH SAHELI, MIRCEA V. DIUDEA
- Page 235 and 236:
MAHBOUBEH SAHELI, ALI REZA ASHRAFI,
- Page 237 and 238:
MAHBOUBEH SAHELI, ALI REZA ASHRAFI,
- Page 239 and 240:
MAHBOUBEH SAHELI, ALI REZA ASHRAFI,
- Page 242 and 243:
STUDIA UBB. CHEMIA, LV, 4, 2010 OME
- Page 244 and 245:
OMEGA POLYNOMIAL IN CRYSTAL-LIKE NE
- Page 246 and 247:
OMEGA POLYNOMIAL IN CRYSTAL-LIKE NE
- Page 248 and 249:
STUDIA UBB. CHEMIA, LV, 4, 2010 CLU
- Page 250 and 251:
CLUJ CJ POLYNOMIAL AND INDICES IN A
- Page 252 and 253:
CLUJ CJ POLYNOMIAL AND INDICES IN A
- Page 254:
CLUJ CJ POLYNOMIAL AND INDICES IN A
- Page 257 and 258:
ALI REZA ASHRAFI, ASEFEH KARBASIOUN
- Page 259 and 260:
ALI REZA ASHRAFI, ASEFEH KARBASIOUN
- Page 261 and 262:
ALI REZA ASHRAFI, ASEFEH KARBASIOUN
- Page 263 and 264:
POPA IULIANA, DRAGOŞ ANA, VLĂTĂN
- Page 265 and 266:
POPA IULIANA, DRAGOŞ ANA, VLĂTĂN
- Page 267 and 268:
POPA IULIANA, DRAGOŞ ANA, VLĂTĂN
- Page 269 and 270:
POPA IULIANA, DRAGOŞ ANA, VLĂTĂN
- Page 271 and 272:
ALI IRANMANESH, YASER ALIZADEH, SAM
- Page 273 and 274:
ALI IRANMANESH, YASER ALIZADEH, SAM
- Page 275 and 276:
ALI IRANMANESH, YASER ALIZADEH, SAM
- Page 277 and 278:
KLAUDIA KOVÁCS, ANDRÁS HOLCZINGER
- Page 279 and 280:
KLAUDIA KOVÁCS, ANDRÁS HOLCZINGER
- Page 281 and 282:
KLAUDIA KOVÁCS, ANDRÁS HOLCZINGER
- Page 283 and 284:
KLAUDIA KOVÁCS, ANDRÁS HOLCZINGER
- Page 285 and 286:
DIÁNA WEISER, ANNA TOMIN, LÁSZLÓ
- Page 287 and 288:
DIÁNA WEISER, ANNA TOMIN, LÁSZLÓ
- Page 289 and 290:
DIÁNA WEISER, ANNA TOMIN, LÁSZLÓ
- Page 291 and 292:
P. FALUS, Z. BOROS, G. HORNYÁNSZKY
- Page 293 and 294:
P. FALUS, Z. BOROS, G. HORNYÁNSZKY
- Page 295 and 296:
P. FALUS, Z. BOROS, G. HORNYÁNSZKY
- Page 297 and 298:
P. FALUS, Z. BOROS, G. HORNYÁNSZKY
- Page 299 and 300:
L. VLASE, M. PÂRVU, A. TOIU, E. A.
- Page 301 and 302:
L. VLASE, M. PÂRVU, A. TOIU, E. A.
- Page 303 and 304:
L. VLASE, M. PÂRVU, A. TOIU, E. A.
- Page 305 and 306:
L. VLASE, M. PÂRVU, A. TOIU, E. A.
- Page 307 and 308:
LAURIAN VLASE, DANA MUNTEAN, MARCEL
- Page 309 and 310:
LAURIAN VLASE, DANA MUNTEAN, MARCEL
- Page 311 and 312:
LAURIAN VLASE, DANA MUNTEAN, MARCEL
- Page 313 and 314:
LAURIAN VLASE, DANA MUNTEAN, MARCEL
- Page 315 and 316:
CRISTINA BISCHIN, VICENTIU TACIUC,
- Page 317 and 318:
CRISTINA BISCHIN, VICENTIU TACIUC,
- Page 319 and 320:
CRISTINA BISCHIN, VICENTIU TACIUC,
- Page 321 and 322:
MIRCEA V. DIUDEA ⎧max l( pi, j),
- Page 323 and 324:
MIRCEA V. DIUDEA Pi () k = [ LM, Sh
- Page 325:
MIRCEA V. DIUDEA CONCLUSIONS The re


