Crisman Annual Report 2009 - Harold Vance Department of ...
Crisman Annual Report 2009 - Harold Vance Department of ...
Crisman Annual Report 2009 - Harold Vance Department of ...

You also want an ePaper? Increase the reach of your titles
YUMPU automatically turns print PDFs into web optimized ePapers that Google loves.
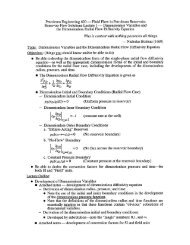
Modeling and Analysis <strong>of</strong> Reservoir Response to Stimulation by Water Injection<br />
Objectives<br />
The distributions <strong>of</strong> pore pressure and stresses<br />
around a fracture are <strong>of</strong> interest in conventional<br />
hydraulic fracturing operations, fracturing during<br />
water-flooding <strong>of</strong> petroleum reservoirs, shale gas,<br />
and injection/extraction operations in a geothermal<br />
reservoir. During the operations, the pore pressure<br />
will increase with fluid injection into the fracture<br />
and leak <strong>of</strong>f to surround the formation. The pore<br />
pressure increase will induce the stress variations<br />
around the fracture surface. This can cause the<br />
slip <strong>of</strong> weakness planes in the formation and cause<br />
the variation <strong>of</strong> the permeability in the reservoir.<br />
Therefore, the investigation on the pore pressure<br />
and stress variations around a hydraulic fracture in<br />
petroleum and geothermal reservoirs has practical<br />
applications. With the pore pressure distribution,<br />
the failed reservoir volume can be estimated by<br />
considering the failure <strong>of</strong> rock mass.<br />
Y, ft<br />
3000<br />
2400<br />
1800<br />
1200<br />
(psi)<br />
6558.00<br />
600<br />
6148.33<br />
5738.67<br />
0<br />
5329.00<br />
4919.33<br />
-600<br />
4509.67<br />
4100.00<br />
-1200<br />
-1800<br />
-2400<br />
-3000 -2400 -1800 -1200 -600 0 600 1200 1800 2400<br />
X, ft<br />
Fig. 1. Pore Pressure Distribution around a Hydraulic Fracture.<br />
Approach<br />
In our study, we built up a model (FracJStim model)<br />
to calculate the pore pressure distribution around a<br />
fracture <strong>of</strong> a given length under the action <strong>of</strong> applied<br />
internal pressure and in-situ stresses as well as their<br />
variation due to cooling and pore pressure changes<br />
(Fig. 1). In the FracJStim model, the Structural<br />
Permeability Diagram (Fig. 2) is used to estimate<br />
the required additional pore pressure to reactivate<br />
the joints in the rock formations <strong>of</strong> the reservoir. By<br />
estimating the failed reservoir volume and comparing<br />
it with the actual stimulated reservoir volume, the<br />
enhanced reservoir permeability in the stimulated<br />
zone can be approximated.<br />
0<br />
270 90<br />
180<br />
Fig. 2. Structural Permeability Diagram for Barnett Shale.<br />
P<br />
(psi/ft)<br />
0.50<br />
0.06<br />
Significance<br />
This work is <strong>of</strong> interest in interpretation <strong>of</strong> microseismicity<br />
in hydraulic fracturing and in assessing<br />
permeability variation around a stimulation zone.<br />
The work can also be used to assess the accuracy <strong>of</strong><br />
more complex numerical models.<br />
Future Work<br />
We will continue developing the model to three<br />
Dimensions, including the stresses variations and<br />
heterogeneous conditions. We will also improve<br />
the application <strong>of</strong> this work by simulating multiple<br />
fractures.<br />
CRISMAN INSTITUTE<br />
Project Information<br />
2.5.10 Pore Pressure and Stress Distributions around an<br />
Injection-Induced Fracture<br />
Contacts<br />
Ahmad Ghassemi<br />
979.845.2206<br />
ahmad.ghassemi@pe.tamu.edu<br />
Jun Ge<br />
<strong>Crisman</strong> <strong>Annual</strong> <strong>Report</strong> <strong>2009</strong><br />
61