Published Report (DOT/FAA/CT-94-36)
Published Report (DOT/FAA/CT-94-36)
Published Report (DOT/FAA/CT-94-36)

Create successful ePaper yourself
Turn your PDF publications into a flip-book with our unique Google optimized e-Paper software.
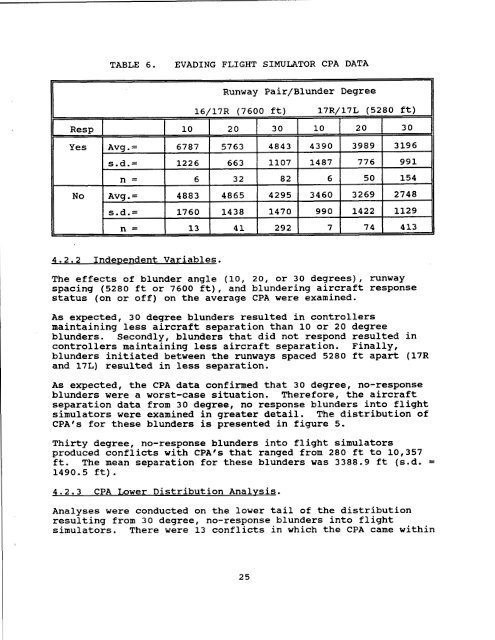
TABLE 6.<br />
EVADING FLIGHT SIMULATOR CPA DATA<br />
4.2.2 Independent Variables.<br />
The effects of blunder angle (10, 20, or 30 degrees), runway<br />
spacing (5280 ft or 7600 ft), and blundering aircraft response<br />
status (on or off) on the average CPA were examined.<br />
As expected, 30 degree blunders resulted in controllers<br />
maintaining less aircraft separation than 10 or 20 degree<br />
blunders. Secondly, blunders that did not respond resulted in<br />
controllers maintaining less aircraft separation. Finally,<br />
blunders initiated between the runways spaced 5280 ft apart (17R<br />
and 17L) resulted in less separation.<br />
As expected, the CPA data confirmed that 30 degree, no-response<br />
blunders were a worst-case situation. Therefore, the aircraft<br />
separation data from 30 degree, no response blunders into flight<br />
simulators were examined in greater detail. The distribution of<br />
CPA's for these blunders is presented in figure 5.<br />
Thirty degree, no-response blunders into flight simulators<br />
produced conflicts with CPA's that ranged from 280 ft to 10,357<br />
ft. The mean separation for these blunders was 3388.9 ft (s.d. =<br />
1490.5 ft).<br />
4.2.3 CPA Lower Distribution Analysis.<br />
Analyses were conducted on the lower tail of the distribution<br />
resulting from 30 degree, no-response blunders into flight<br />
simulators. There were 13 conflicts in which the CPA came within<br />
25