

Annual Report - SEI
Annual Report - SEI
Annual Report - SEI

You also want an ePaper? Increase the reach of your titles
YUMPU automatically turns print PDFs into web optimized ePapers that Google loves.
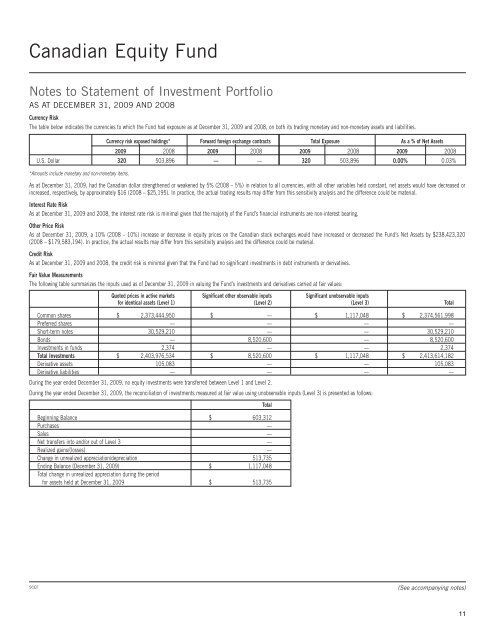
Canadian Equity Fund<br />
Notes to Statement of Investment Portfolio<br />
AS AT DECEMBER 31, 2009 AND 2008<br />
Currency Risk<br />
The table below indicates the currencies to which the Fund had exposure as at December 31, 2009 and 2008, on both its trading monetary and non-monetary assets and liabilities.<br />
Currency risk exposed holdings* Forward foreign exchange contracts Total Exposure As a % of Net Assets<br />
2009 2008 2009 2008 2009 2008 2009 2008<br />
U.S. Dollar 320 503,896 — — 320 503,896 0.00% 0.03%<br />
*Amounts include monetary and non-monetary items.<br />
As at December 31, 2009, had the Canadian dollar strengthened or weakened by 5% (2008 – 5%) in relation to all currencies, with all other variables held constant, net assets would have decreased or<br />
increased, respectively, by approximately $16 (2008 – $25,195). In practice, the actual trading results may differ from this sensitivity analysis and the difference could be material.<br />
Interest Rate Risk<br />
As at December 31, 2009 and 2008, the interest rate risk is minimal given that the majority of the Fund’s financial instruments are non-interest bearing.<br />
Other Price Risk<br />
As at December 31, 2009, a 10% (2008 – 10%) increase or decrease in equity prices on the Canadian stock exchanges would have increased or decreased the Fund’s Net Assets by $238,423,320<br />
(2008 – $179,583,194). In practice, the actual results may differ from this sensitivity analysis and the difference could be material.<br />
Credit Risk<br />
As at December 31, 2009 and 2008, the credit risk is minimal given that the Fund had no significant investments in debt instruments or derivatives.<br />
Fair Value Measurements<br />
The following table summarizes the inputs used as of December 31, 2009 in valuing the Fund’s investments and derivatives carried at fair values:<br />
Quoted prices in active markets Significant other observable inputs Significant unobservable inputs<br />
for identical assets (Level 1) (Level 2) (Level 3) Total<br />
Common shares $ 2,373,444,950 $ — $ 1,117,048 $ 2,374,561,998<br />
Preferred shares — — — —<br />
Short-term notes 30,529,210 — — 30,529,210<br />
Bonds — 8,520,600 — 8,520,600<br />
Investments in funds 2,374 — — 2,374<br />
Total Investments $ 2,403,976,534 $ 8,520,600 $ 1,117,048 $ 2,413,614,182<br />
Derivative assets 105,083 — — 105,083<br />
Derivative liabilities — — — —<br />
During the year ended December 31, 2009, no equity investments were transferred between Level 1 and Level 2.<br />
During the year ended December 31, 2009, the reconciliation of investments measured at fair value using unobservable inputs (Level 3) is presented as follows:<br />
Beginning Balance $ 603,312<br />
Purchases —<br />
Sales —<br />
Net transfers into and/or out of Level 3 —<br />
Realized gains/(losses) —<br />
Change in unrealized appreciation/depreciation 513,735<br />
Ending Balance (December 31, 2009) $ 1,117,048<br />
Total change in unrealized appreciation during the period<br />
for assets held at December 31, 2009 $ 513,735<br />
Total<br />
SCEF<br />
(See accompanying notes)<br />
11


