Annual Report - SEI
Annual Report - SEI
Annual Report - SEI
Create successful ePaper yourself
Turn your PDF publications into a flip-book with our unique Google optimized e-Paper software.
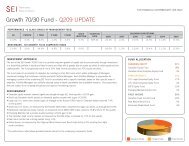
Global Growth 100 Fund<br />
Statements of Net Assets<br />
AS AT DECEMBER 31<br />
(in thousands of dollars except per unit data)<br />
2009 2008<br />
ASSETS<br />
Investments at fair value $ 21,030 $ 19,990<br />
Cash including foreign currency holdings,<br />
at fair value 84 115<br />
Receivable for unit subscriptions 39 77<br />
21,153 20,182<br />
LIABILITIES<br />
Accrued liabilities 32 41<br />
Payable for unit redemptions 81 10<br />
113 51<br />
NET ASSETS REPRESENTING<br />
UNITHOLDERS’ EQUITY $ 21,040 $ 20,131<br />
NET ASSETS PER CLASS<br />
(Class O) $ 3,339 $ 2,809<br />
(Class P) $ 15,917 $ 15,655<br />
(Class F) $ 593 $ 579<br />
(Class R) $ 1,191 $ 1,088<br />
NET ASSETS PER UNIT (note 7)<br />
(Class O) $ 3.83 $ 3.25<br />
(Class P) $ 3.66 $ 3.16<br />
(Class F) $ 3.95 $ 3.36<br />
(Class R) $ 3.83 $ 3.26<br />
INVESTMENTS AT AVERAGE COST $ 24,654 $ 29,240<br />
Statements of Operations<br />
FOR THE YEARS ENDED DECEMBER 31<br />
(in thousands of dollars except per unit data)<br />
2009 2008<br />
INVESTMENT INCOME<br />
Interest $ — $ 3<br />
Distributions from mutual funds 555 378<br />
555 381<br />
EXPENSES<br />
Custodian and administration fees 23 29<br />
Legal fees 14 17<br />
Audit fees 1 1<br />
Management fees 364 449<br />
Independent Review Committee fees 1 2<br />
Securityholder reporting costs 9 12<br />
412 510<br />
Waived expenses (6) (16)<br />
406 494<br />
NET INVESTMENT INCOME (LOSS)<br />
FOR THE PERIOD $ 149 $ (113)<br />
NET GAIN (LOSS) ON SALES OF SECURITIES $ (2,686) $ (1,333)<br />
UNREALIZED APPRECIATION (DEPRECIATION)<br />
OF INVESTMENTS $ 5,627 $ (7,620)<br />
NET GAIN (LOSS) ON INVESTMENTS $ 2,941 $ (8,953)<br />
NET INCREASE (DECREASE) IN NET ASSETS<br />
FROM OPERATIONS $ 3,090 $ (9,066)<br />
INCREASE (DECREASE) IN NET ASSETS<br />
FROM OPERATIONS<br />
(Class O) $ 524 $ (1,329)<br />
(Class P) $ 2,293 $ (7,319)<br />
(Class F) $ 109 $ (157)<br />
(Class R) $ 164 $ (261)<br />
INCREASE (DECREASE) IN NET ASSETS<br />
FROM OPERATIONS PER UNIT*<br />
(Class O) $ 0.57 $ (1.46)<br />
(Class P) $ 0.49 $ (1.56)<br />
(Class F) $ 0.60 $ (1.36)<br />
(Class R) $ 0.53 $ (1.28)<br />
* Based on the weighted average number of units outstanding during the period.<br />
SGEF<br />
(See accompanying notes)<br />
181


