EAFE Equity Fund Notes to Statement of Investment Portfolio AS AT DECEMBER 31, 2009 AND 2008 Currency Risk The table below indicates the currencies to which the Fund had exposure as at December 31, 2009 and 2008, on both its trading monetary and non-monetary assets and liabilities. Currency risk exposed holdings* Spot and forward foreign exchange contracts Total Exposure As a % of Net Assets 2009 2008 2009 2008 2009 2008 2009 2008 Euro Currency Unit 189,851,926 218,391,408 116,476 1,035,053 189,968,402 219,426,461 28.87% 33.34% Japanese Yen 124,107,269 156,597,114 20,282 — 124,127,551 156,597,114 18.87% 23.79% British Pound 125,152,257 119,782,631 — (31,194) 125,152,257 119,751,437 19.02% 18.19% Swiss Franc 54,142,723 58,489,127 — (428,734) 54,142,723 58,060,393 8.23% 8.82% Australian Dollar 43,174,103 30,003,833 — — 43,174,103 30,003,833 6.56% 4.56% Hong Kong Dollar 21,504,825 18,006,637 (147,341) — 21,357,484 18,006,637 3.25% 2.74% U.S. Dollar 22,335,404 11,483,282 (197,032) — 22,138,372 11,483,282 3.36% 1.74% Swedish Krona 12,349,009 11,134,682 — — 12,349,009 11,134,682 1.88% 1.69% Singapore Dollar 13,643,470 5,220,969 — — 13,643,470 5,220,969 2.07% 0.79% Danish Krone 3,914,501 4,651,021 — — 3,914,501 4,651,021 0.59% 0.71% Norwegian Krone 7,049,724 4,071,015 — — 7,049,724 4,071,015 1.07% 0.62% South Korean Won 3,611,747 2,075,745 — — 3,611,747 2,075,745 0.55% 0.32% Taiwan Dollar 2,916,100 1,387,994 — — 2,916,100 1,387,994 0.44% 0.21% Czech Koruna — 956,502 — — — 956,502 0.00% 0.15% South African Rand 729,125 881,207 — — 729,125 881,207 0.11% 0.13% Thai Baht 408,231 728,713 — — 408,231 728,713 0.06% 0.11% New Turkish Lira 2,879,671 379,707 — — 2,879,671 379,707 0.44% 0.06% New Zealand Dollar 1,147,296 107,223 — — 1,147,296 107,223 0.17% 0.02% Hungarian Forint 435,263 49 — — 435,263 49 0.07% 0.00% Malaysian Ringgit 234,392 — — — 234,392 — 0.04% 0.00% Mexican Peso 90,936 — — — 90,936 — 0.01% 0.00% Phillippine Peso 36,005 — — — 36,005 — 0.01% 0.00% Brazilian Real 3,448,534 — — — 3,448,534 — 0.52% 0.00% Indonesian Rupiah 1,261,058 — — — 1,261,058 — 0.19% 0.00% *Amounts include monetary and non-monetary items. As at December 31, 2009, had the Canadian dollar strengthened or weakened by 5% (2008 – 5%) in relation to all currencies, with all other variables held constant, net assets would have decreased or increased, respectively, by approximately $31,710,798 (2008 – $32,246,199). In practice, the actual trading results may differ from this sensitivity analysis and the difference could be material. Interest Rate Risk As at December 31, 2009 and 2008, the interest rate risk is minimal given that the majority of the Fund’s financial instruments are non-interest bearing. Other Price Risk As at December 31, 2009, a 10% (2008 – 10%) increase or decrease in equity prices on the global stock exchanges would have increased or decreased the Fund’s Net Assets by $64,917,428 (2008 – $64,254,286). In practice, the actual results may differ from this sensitivity analysis and the difference could be material. Credit Risk As at December 31, 2009 and 2008, the credit risk is minimal given that the Fund had no significant investments in debt instruments or derivatives. (See accompanying notes) SEEF 56
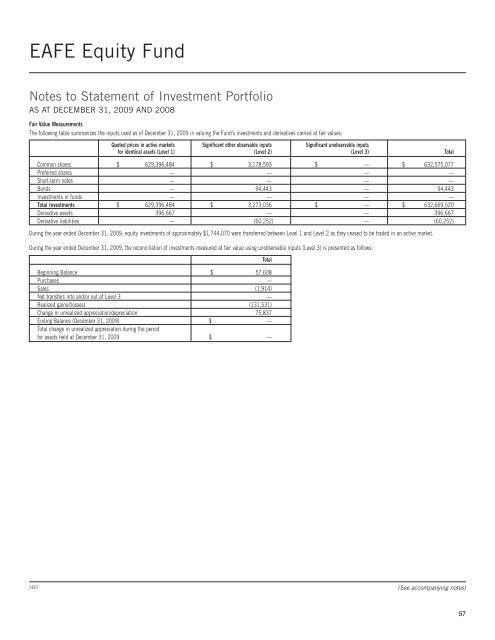
EAFE Equity Fund Notes to Statement of Investment Portfolio AS AT DECEMBER 31, 2009 AND 2008 Fair Value Measurements The following table summarizes the inputs used as of December 31, 2009 in valuing the Fund’s investments and derivatives carried at fair values: Quoted prices in active markets Significant other observable inputs Significant unobservable inputs for identical assets (Level 1) (Level 2) (Level 3) Total Common shares $ 629,396,484 $ 3,178,593 $ — $ 632,575,077 Preferred shares — — — — Short-term notes — — — — Bonds — 94,443 — 94,443 Investments in funds — — — — Total Investments $ 629,396,484 $ 3,273,036 $ — $ 632,669,520 Derivative assets 396,667 — — 396,667 Derivative liabilities — (60,252) — (60,252) During the year ended December 31, 2009, equity investments of approximately $1,744,070 were transferred between Level 1 and Level 2 as they ceased to be traded in an active market. During the year ended December 31, 2009, the reconciliation of investments measured at fair value using unobservable inputs (Level 3) is presented as follows: Total Beginning Balance $ 57,608 Purchases — Sales (1,914) Net transfers into and/or out of Level 3 — Realized gains/(losses) (131,531) Change in unrealized appreciation/depreciation 75,837 Ending Balance (December 31, 2009) $ — Total change in unrealized appreciation during the period for assets held at December 31, 2009 $ — SEEF (See accompanying notes) 57