

Annual Report - SEI
Annual Report - SEI
Annual Report - SEI

You also want an ePaper? Increase the reach of your titles
YUMPU automatically turns print PDFs into web optimized ePapers that Google loves.
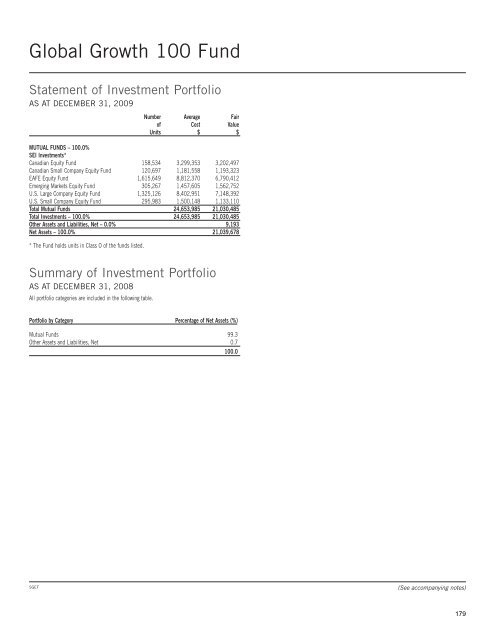
Global Growth 100 Fund<br />
Statement of Investment Portfolio<br />
AS AT DECEMBER 31, 2009<br />
Number Average Fair<br />
of Cost Value<br />
Units $ $<br />
MUTUAL FUNDS – 100.0%<br />
<strong>SEI</strong> Investments*<br />
Canadian Equity Fund 158,534 3,299,353 3,202,497<br />
Canadian Small Company Equity Fund 120,697 1,181,558 1,193,323<br />
EAFE Equity Fund 1,615,649 8,812,370 6,790,412<br />
Emerging Markets Equity Fund 305,267 1,457,605 1,562,752<br />
U.S. Large Company Equity Fund 1,325,126 8,402,951 7,148,392<br />
U.S. Small Company Equity Fund 295,983 1,500,148 1,133,110<br />
Total Mutual Funds 24,653,985 21,030,485<br />
Total Investments – 100.0% 24,653,985 21,030,485<br />
Other Assets and Liabilities, Net – 0.0% 9,193<br />
Net Assets – 100.0% 21,039,678<br />
* The Fund holds units in Class O of the funds listed.<br />
Summary of Investment Portfolio<br />
AS AT DECEMBER 31, 2008<br />
All portfolio categories are included in the following table.<br />
Portfolio by Category Percentage of Net Assets (%)<br />
Mutual Funds 99.3<br />
Other Assets and Liabilities, Net 0.7<br />
100.0<br />
SGEF<br />
(See accompanying notes)<br />
179


