

Annual Report - SEI
Annual Report - SEI
Annual Report - SEI

Create successful ePaper yourself
Turn your PDF publications into a flip-book with our unique Google optimized e-Paper software.
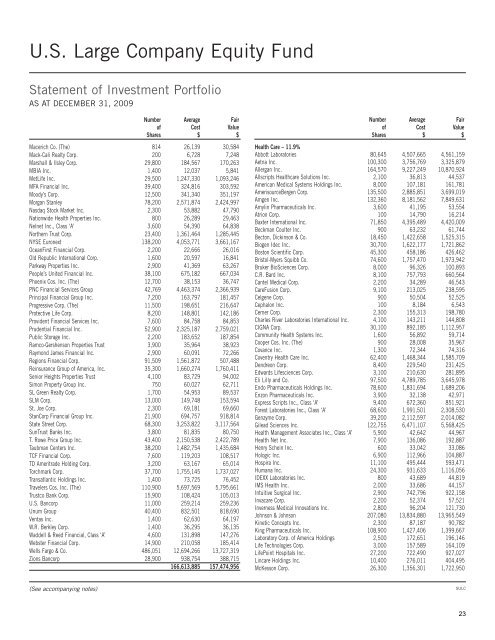
U.S. Large Company Equity Fund<br />
Statement of Investment Portfolio<br />
AS AT DECEMBER 31, 2009<br />
Number Average Fair<br />
of Cost Value<br />
Shares $ $<br />
Macerich Co. (The) 814 26,139 30,584<br />
Mack-Cali Realty Corp. 200 6,728 7,248<br />
Marshall & Ilsley Corp. 29,800 184,567 170,263<br />
MBIA Inc. 1,400 12,037 5,841<br />
MetLife Inc. 29,500 1,247,330 1,093,246<br />
MFA Financial Inc. 39,400 324,816 303,592<br />
Moody’s Corp. 12,500 341,340 351,197<br />
Morgan Stanley 78,200 2,571,874 2,424,997<br />
Nasdaq Stock Market Inc. 2,300 53,882 47,790<br />
Nationwide Health Properties Inc. 800 26,289 29,463<br />
Nelnet Inc., Class ‘A’ 3,600 54,390 64,838<br />
Northern Trust Corp. 23,400 1,361,464 1,285,445<br />
NYSE Euronext 138,200 4,053,771 3,661,167<br />
OceanFirst Financial Corp. 2,200 22,666 26,016<br />
Old Republic International Corp. 1,600 20,597 16,841<br />
Parkway Properties Inc. 2,900 41,369 63,267<br />
People’s United Financial Inc. 38,100 675,182 667,034<br />
Phoenix Cos. Inc. (The) 12,700 38,153 36,747<br />
PNC Financial Services Group 42,769 4,463,374 2,366,939<br />
Principal Financial Group Inc. 7,200 163,797 181,457<br />
Progressive Corp. (The) 11,500 198,651 216,647<br />
Protective Life Corp. 8,200 148,801 142,186<br />
Provident Financial Services Inc. 7,600 84,758 84,853<br />
Prudential Financial Inc. 52,900 2,325,187 2,759,021<br />
Public Storage Inc. 2,200 183,652 187,854<br />
Ramco-Gershenson Properties Trust 3,900 35,964 38,923<br />
Raymond James Financial Inc. 2,900 60,091 72,266<br />
Regions Financial Corp. 91,509 1,561,872 507,488<br />
Reinsurance Group of America, Inc. 35,300 1,660,274 1,760,411<br />
Senior Heights Properties Trust 4,100 83,729 94,002<br />
Simon Property Group Inc. 750 60,027 62,711<br />
SL Green Realty Corp. 1,700 54,953 89,537<br />
SLM Corp. 13,000 149,748 153,594<br />
St. Joe Corp. 2,300 69,181 69,660<br />
StanCorp Financial Group Inc. 21,900 694,757 918,814<br />
State Street Corp. 68,300 3,253,822 3,117,564<br />
SunTrust Banks Inc. 3,800 81,835 80,750<br />
T. Rowe Price Group Inc. 43,400 2,150,538 2,422,789<br />
Taubman Centers Inc. 38,200 1,482,754 1,435,684<br />
TCF Financial Corp. 7,600 119,203 108,517<br />
TD Ameritrade Holding Corp. 3,200 63,167 65,014<br />
Torchmark Corp. 37,700 1,755,145 1,737,027<br />
Transatlantic Holdings Inc. 1,400 73,725 76,452<br />
Travelers Cos. Inc. (The) 110,900 5,697,569 5,795,661<br />
Trustco Bank Corp. 15,900 108,424 105,013<br />
U.S. Bancorp 11,000 259,214 259,236<br />
Unum Group 40,400 832,501 818,690<br />
Ventas Inc. 1,400 62,630 64,197<br />
W.R. Berkley Corp. 1,400 36,295 36,135<br />
Waddell & Reed Financial, Class ‘A’ 4,600 131,898 147,276<br />
Webster Financial Corp. 14,900 210,058 185,414<br />
Wells Fargo & Co. 486,051 12,694,266 13,727,319<br />
Zions Bancorp 28,900 938,754 388,715<br />
166,613,885 157,474,956<br />
Number Average Fair<br />
of Cost Value<br />
Shares $ $<br />
Health Care – 11.9%<br />
Abbott Laboratories 80,645 4,507,665 4,561,159<br />
Aetna Inc. 100,300 3,756,769 3,325,879<br />
Allergan Inc. 164,570 9,227,249 10,870,924<br />
Allscripts Healthcare Solutions Inc. 2,100 36,813 44,537<br />
American Medical Systems Holdings Inc. 8,000 107,181 161,781<br />
AmerisourceBergen Corp. 135,500 2,885,851 3,699,019<br />
Amgen Inc. 132,360 8,181,562 7,849,631<br />
Amylin Pharmaceuticals Inc. 3,600 41,195 53,554<br />
Atrion Corp. 100 14,790 16,214<br />
Baxter International Inc. 71,850 4,395,489 4,420,009<br />
Beckman Coulter Inc. 900 63,232 61,744<br />
Becton, Dickinson & Co. 18,450 1,422,658 1,525,315<br />
Biogen Idec Inc. 30,700 1,622,177 1,721,862<br />
Boston Scientific Corp. 45,300 458,186 426,462<br />
Bristol-Myers Squibb Co. 74,600 1,757,470 1,973,942<br />
Bruker BioSciences Corp. 8,000 96,326 100,893<br />
C.R. Bard Inc. 8,100 757,793 660,564<br />
Cantel Medical Corp. 2,200 34,289 46,543<br />
CareFusion Corp. 9,100 213,025 238,595<br />
Celgene Corp. 900 50,504 52,525<br />
Cephalon Inc. 100 8,184 6,543<br />
Cerner Corp. 2,300 155,313 198,780<br />
Charles River Laboratories International Inc. 4,100 143,211 144,808<br />
CIGNA Corp. 30,100 892,185 1,112,957<br />
Community Health Systems Inc. 1,600 56,892 59,714<br />
Cooper Cos. Inc. (The) 900 28,008 35,967<br />
Covance Inc. 1,300 72,344 74,316<br />
Coventry Health Care Inc. 62,400 1,468,344 1,585,709<br />
Dendreon Corp. 8,400 229,540 231,425<br />
Edwards Lifesciences Corp. 3,100 210,630 281,895<br />
Eli Lilly and Co. 97,500 4,789,785 3,645,978<br />
Endo Pharmaceuticals Holdings Inc. 78,600 1,831,694 1,689,206<br />
Enzon Pharmaceuticals Inc. 3,900 32,138 42,971<br />
Express Scripts Inc., Class ‘A’ 9,400 672,360 851,921<br />
Forest Laboratories Inc., Class ‘A’ 68,600 1,991,501 2,308,530<br />
Genzyme Corp. 39,200 2,112,597 2,014,082<br />
Gilead Sciences Inc. 122,755 6,471,107 5,568,425<br />
Health Management Associates Inc., Class ‘A’ 5,900 42,642 44,967<br />
Health Net Inc. 7,900 136,086 192,887<br />
Henry Schein Inc. 600 33,042 33,086<br />
Hologic Inc. 6,900 112,966 104,887<br />
Hospira Inc. 11,100 495,444 593,471<br />
Humana Inc. 24,300 931,633 1,116,056<br />
IDEXX Laboratories Inc. 800 43,689 44,819<br />
IMS Health Inc. 2,000 33,686 44,157<br />
Intuitive Surgical Inc. 2,900 742,796 922,158<br />
Invacare Corp. 2,200 52,374 57,521<br />
Inverness Medical Innovations Inc. 2,800 96,204 121,730<br />
Johnson & Johnson 207,080 13,834,880 13,965,549<br />
Kinetic Concepts Inc. 2,300 87,187 90,782<br />
King Pharmaceuticals Inc. 108,900 1,427,406 1,399,667<br />
Laboratory Corp. of America Holdings 2,500 172,651 196,146<br />
Life Technologies Corp. 3,000 157,589 164,109<br />
LifePoint Hospitals Inc. 27,200 722,490 927,027<br />
Lincare Holdings Inc. 10,400 276,011 404,495<br />
McKesson Corp. 26,300 1,356,301 1,722,950<br />
(See accompanying notes)<br />
SULC<br />
23


