

Annual Report - SEI
Annual Report - SEI
Annual Report - SEI

You also want an ePaper? Increase the reach of your titles
YUMPU automatically turns print PDFs into web optimized ePapers that Google loves.
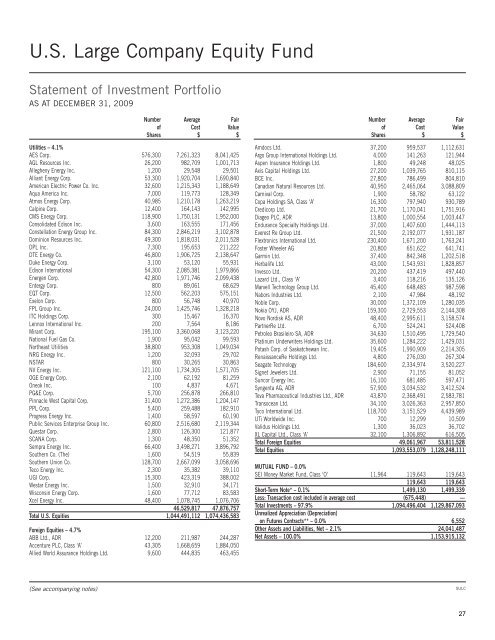
U.S. Large Company Equity Fund<br />
Statement of Investment Portfolio<br />
AS AT DECEMBER 31, 2009<br />
Number Average Fair<br />
of Cost Value<br />
Shares $ $<br />
Utilities – 4.1%<br />
AES Corp. 576,300 7,261,323 8,041,425<br />
AGL Resources Inc. 26,200 982,709 1,001,713<br />
Allegheny Energy Inc. 1,200 29,548 29,501<br />
Alliant Energy Corp. 53,300 1,920,704 1,690,840<br />
American Electric Power Co. Inc. 32,600 1,215,343 1,188,649<br />
Aqua America Inc. 7,000 119,773 128,349<br />
Atmos Energy Corp. 40,985 1,210,178 1,263,219<br />
Calpine Corp. 12,400 164,143 142,995<br />
CMS Energy Corp. 118,900 1,750,131 1,952,000<br />
Consolidated Edison Inc. 3,600 163,555 171,456<br />
Constellation Energy Group Inc. 84,300 2,846,219 3,102,878<br />
Dominion Resources Inc. 49,300 1,818,031 2,011,528<br />
DPL Inc. 7,300 195,653 211,222<br />
DTE Energy Co. 46,800 1,906,725 2,138,647<br />
Duke Energy Corp. 3,100 53,120 55,931<br />
Edison International 54,300 2,085,381 1,979,866<br />
Energen Corp. 42,800 1,971,746 2,099,438<br />
Entergy Corp. 800 89,061 68,629<br />
EQT Corp. 12,500 562,203 575,151<br />
Exelon Corp. 800 56,748 40,970<br />
FPL Group Inc. 24,000 1,425,746 1,328,218<br />
ITC Holdings Corp. 300 15,467 16,370<br />
Lennox International Inc. 200 7,564 8,186<br />
Mirant Corp. 195,100 3,360,068 3,123,220<br />
National Fuel Gas Co. 1,900 95,042 99,593<br />
Northeast Utilities 38,800 953,308 1,049,034<br />
NRG Energy Inc. 1,200 32,093 29,702<br />
NSTAR 800 30,265 30,863<br />
NV Energy Inc. 121,100 1,734,305 1,571,705<br />
OGE Energy Corp. 2,100 62,192 81,259<br />
Oneok Inc. 100 4,837 4,671<br />
PG&E Corp. 5,700 256,878 266,810<br />
Pinnacle West Capital Corp. 31,400 1,272,386 1,204,147<br />
PPL Corp. 5,400 259,488 182,910<br />
Progress Energy Inc. 1,400 58,597 60,190<br />
Public Services Enterprise Group Inc. 60,800 2,516,680 2,119,344<br />
Questar Corp. 2,800 126,300 121,877<br />
SCANA Corp. 1,300 48,350 51,352<br />
Sempra Energy Inc. 66,400 3,498,271 3,896,792<br />
Southern Co. (The) 1,600 54,519 55,839<br />
Southern Union Co. 128,700 2,667,099 3,058,696<br />
Teco Energy Inc. 2,300 35,382 39,110<br />
UGI Corp. 15,300 423,319 388,002<br />
Westar Energy Inc. 1,500 32,910 34,171<br />
Wisconsin Energy Corp. 1,600 77,712 83,583<br />
Xcel Energy Inc. 48,400 1,078,745 1,076,706<br />
46,529,817 47,876,757<br />
Total U.S. Equities 1,044,491,112 1,074,436,583<br />
Foreign Equities – 4.7%<br />
ABB Ltd., ADR 12,200 211,987 244,287<br />
Accenture PLC, Class ‘A’ 43,305 1,668,659 1,884,050<br />
Allied World Assurance Holdings Ltd. 9,600 444,835 463,455<br />
Number Average Fair<br />
of Cost Value<br />
Shares $ $<br />
Amdocs Ltd. 37,200 959,537 1,112,631<br />
Argo Group International Holdings Ltd. 4,000 141,263 121,944<br />
Aspen Insurance Holdings Ltd. 1,800 49,248 48,025<br />
Axis Capital Holdings Ltd. 27,200 1,039,765 810,115<br />
BCE Inc. 27,800 786,499 804,810<br />
Canadian Natural Resources Ltd. 40,950 2,465,064 3,088,809<br />
Carnival Corp. 1,900 58,782 63,122<br />
Copa Holdings SA, Class ‘A’ 16,300 797,940 930,789<br />
Credicorp Ltd. 21,700 1,170,041 1,751,916<br />
Diageo PLC, ADR 13,800 1,000,554 1,003,447<br />
Endurance Specialty Holdings Ltd. 37,000 1,407,600 1,444,113<br />
Everest Re Group Ltd. 21,500 2,192,077 1,931,187<br />
Flextronics International Ltd. 230,400 1,671,200 1,763,241<br />
Foster Wheeler AG 20,800 651,622 641,741<br />
Garmin Ltd. 37,400 842,348 1,202,518<br />
Herbalife Ltd. 43,000 1,543,931 1,828,857<br />
Invesco Ltd. 20,200 437,419 497,440<br />
Lazard Ltd., Class ‘A’ 3,400 118,216 135,126<br />
Marvell Technology Group Ltd. 45,400 648,483 987,598<br />
Nabors Industries Ltd. 2,100 47,984 48,192<br />
Noble Corp. 30,000 1,372,109 1,280,035<br />
Nokia OYJ, ADR 159,300 2,729,553 2,144,308<br />
Novo Nordisk AS, ADR 48,400 2,995,611 3,158,574<br />
PartnerRe Ltd. 6,700 524,241 524,408<br />
Petroleo Brasileiro SA, ADR 34,630 1,510,495 1,729,540<br />
Platinum Underwriters Holdings Ltd. 35,600 1,284,222 1,429,031<br />
Potash Corp. of Saskatchewan Inc. 19,405 1,990,909 2,214,305<br />
RenaissanceRe Holdings Ltd. 4,800 276,030 267,304<br />
Seagate Technology 184,600 2,334,974 3,520,227<br />
Signet Jewelers Ltd. 2,900 71,155 81,052<br />
Suncor Energy Inc. 16,100 681,485 597,471<br />
Syngenta AG, ADR 57,900 3,034,532 3,412,524<br />
Teva Pharmaceutical Industries Ltd., ADR 43,870 2,368,491 2,583,781<br />
Transocean Ltd. 34,100 3,026,363 2,957,850<br />
Tyco International Ltd. 118,700 3,151,529 4,439,989<br />
UTi Worldwide Inc. 700 12,299 10,509<br />
Validus Holdings Ltd. 1,300 36,023 36,702<br />
XL Capital Ltd., Class ‘A’ 32,100 1,306,892 616,505<br />
Total Foreign Equities 49,061,967 53,811,528<br />
Total Equities 1,093,553,079 1,128,248,111<br />
MUTUAL FUND – 0.0%<br />
<strong>SEI</strong> Money Market Fund, Class ‘O’ 11,964 119,643 119,643<br />
119,643 119,643<br />
Short-Term Note* – 0.1% 1,499,130 1,499,339<br />
Less: Transaction cost included in average cost (675,448) —<br />
Total Investments – 97.9% 1,094,496,404 1,129,867,093<br />
Unrealized Appreciation (Depreciation)<br />
on Futures Contracts** – 0.0% 6,552<br />
Other Assets and Liabilities, Net – 2.1% 24,041,487<br />
Net Assets – 100.0% 1,153,915,132<br />
(See accompanying notes)<br />
SULC<br />
27


