

Annual Report - SEI
Annual Report - SEI
Annual Report - SEI

Create successful ePaper yourself
Turn your PDF publications into a flip-book with our unique Google optimized e-Paper software.
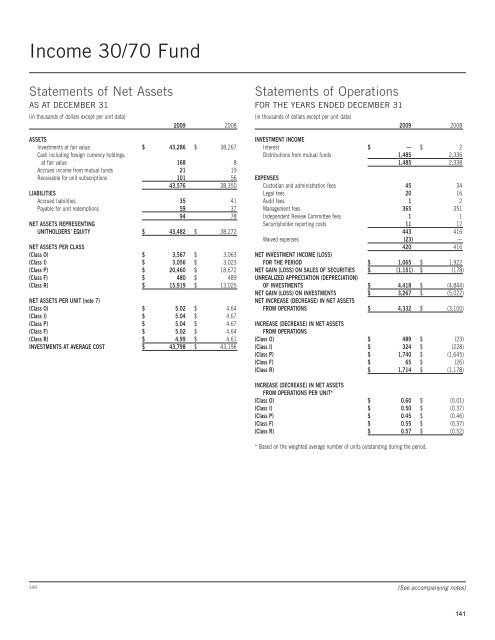
Income 30/70 Fund<br />
Statements of Net Assets<br />
AS AT DECEMBER 31<br />
(in thousands of dollars except per unit data)<br />
2009 2008<br />
ASSETS<br />
Investments at fair value $ 43,286 $ 38,267<br />
Cash including foreign currency holdings,<br />
at fair value 168 8<br />
Accrued income from mutual funds 21 19<br />
Receivable for unit subscriptions 101 56<br />
43,576 38,350<br />
LIABILITIES<br />
Accrued liabilities 35 41<br />
Payable for unit redemptions 59 37<br />
94 78<br />
NET ASSETS REPRESENTING<br />
UNITHOLDERS’ EQUITY $ 43,482 $ 38,272<br />
NET ASSETS PER CLASS<br />
(Class O) $ 3,567 $ 3,063<br />
(Class I) $ 3,056 $ 3,023<br />
(Class P) $ 20,460 $ 18,672<br />
(Class F) $ 480 $ 489<br />
(Class R) $ 15,919 $ 13,025<br />
NET ASSETS PER UNIT (note 7)<br />
(Class O) $ 5.02 $ 4.64<br />
(Class I) $ 5.04 $ 4.67<br />
(Class P) $ 5.04 $ 4.67<br />
(Class F) $ 5.02 $ 4.64<br />
(Class R) $ 4.99 $ 4.61<br />
INVESTMENTS AT AVERAGE COST $ 43,798 $ 43,196<br />
Statements of Operations<br />
FOR THE YEARS ENDED DECEMBER 31<br />
(in thousands of dollars except per unit data)<br />
2009 2008<br />
INVESTMENT INCOME<br />
Interest $ — $ 2<br />
Distributions from mutual funds 1,485 2,336<br />
1,485 2,338<br />
EXPENSES<br />
Custodian and administration fees 45 34<br />
Legal fees 20 16<br />
Audit fees 1 2<br />
Management fees 365 351<br />
Independent Review Committee fees 1 1<br />
Securityholder reporting costs 11 12<br />
443 416<br />
Waived expenses (23) —<br />
420 416<br />
NET INVESTMENT INCOME (LOSS)<br />
FOR THE PERIOD $ 1,065 $ 1,922<br />
NET GAIN (LOSS) ON SALES OF SECURITIES $ (1,151) $ (178)<br />
UNREALIZED APPRECIATION (DEPRECIATION)<br />
OF INVESTMENTS $ 4,418 $ (4,844)<br />
NET GAIN (LOSS) ON INVESTMENTS $ 3,267 $ (5,022)<br />
NET INCREASE (DECREASE) IN NET ASSETS<br />
FROM OPERATIONS $ 4,332 $ (3,100)<br />
INCREASE (DECREASE) IN NET ASSETS<br />
FROM OPERATIONS<br />
(Class O) $ 489 $ (23)<br />
(Class I) $ 324 $ (228)<br />
(Class P) $ 1,740 $ (1,645)<br />
(Class F) $ 65 $ (26)<br />
(Class R) $ 1,714 $ (1,178)<br />
INCREASE (DECREASE) IN NET ASSETS<br />
FROM OPERATIONS PER UNIT*<br />
(Class O) $ 0.60 $ (0.01)<br />
(Class I) $ 0.50 $ (0.37)<br />
(Class P) $ 0.45 $ (0.46)<br />
(Class F) $ 0.55 $ (0.37)<br />
(Class R) $ 0.57 $ (0.52)<br />
* Based on the weighted average number of units outstanding during the period.<br />
SIGF<br />
(See accompanying notes)<br />
141


