

Annual Report - SEI
Annual Report - SEI
Annual Report - SEI

You also want an ePaper? Increase the reach of your titles
YUMPU automatically turns print PDFs into web optimized ePapers that Google loves.
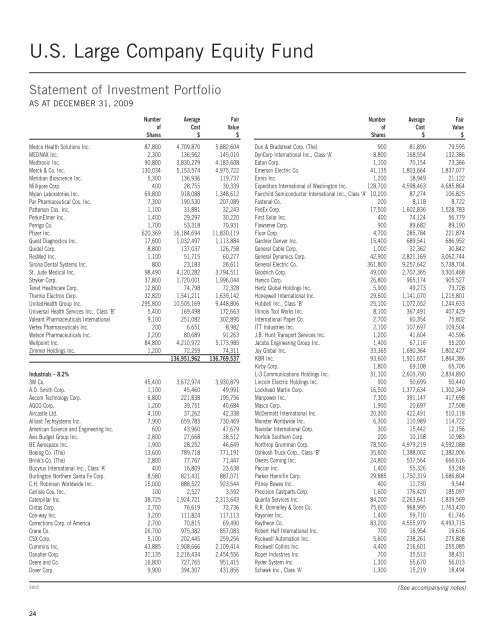
U.S. Large Company Equity Fund<br />
Statement of Investment Portfolio<br />
AS AT DECEMBER 31, 2009<br />
Number Average Fair<br />
of Cost Value<br />
Shares $ $<br />
Medco Health Solutions Inc. 87,800 4,709,870 5,882,604<br />
MEDNAX Inc. 2,300 136,562 145,010<br />
Medtronic Inc. 90,800 3,830,279 4,183,608<br />
Merck & Co. Inc. 130,034 5,153,574 4,975,722<br />
Meridian Bioscience Inc. 5,300 136,936 119,737<br />
Millipore Corp. 400 28,755 30,339<br />
Mylan Laboratories Inc. 69,800 918,088 1,348,612<br />
Par Pharmaceutical Cos. Inc. 7,300 190,530 207,089<br />
Patterson Cos. Inc. 1,100 31,881 32,243<br />
PerkinElmer Inc. 1,400 29,297 30,220<br />
Perrigo Co. 1,700 53,318 70,931<br />
Pfizer Inc. 620,369 16,184,694 11,830,119<br />
Quest Diagnostics Inc. 17,600 1,032,497 1,113,884<br />
Quidel Corp. 8,800 137,037 126,758<br />
ResMed Inc. 1,100 51,715 60,277<br />
Sirona Dental Systems Inc. 800 23,183 26,611<br />
St. Jude Medical Inc. 98,490 4,120,282 3,794,511<br />
Stryker Corp. 37,800 1,720,001 1,996,044<br />
Tenet Healthcare Corp. 12,800 74,798 72,328<br />
Thermo Electron Corp. 32,820 1,541,211 1,639,142<br />
UnitedHealth Group Inc. 295,800 10,505,169 9,448,806<br />
Universal Health Services Inc., Class ‘B’ 5,400 169,498 172,663<br />
Valeant Pharmaceuticals International 9,100 251,082 302,895<br />
Vertex Pharmaceuticals Inc. 200 6,651 8,982<br />
Watson Pharmaceuticals Inc. 2,200 80,689 91,263<br />
Wellpoint Inc. 84,800 4,210,972 5,173,985<br />
Zimmer Holdings Inc. 1,200 72,259 74,311<br />
136,951,962 136,769,537<br />
Industrials – 8.2%<br />
3M Co. 45,400 3,672,974 3,930,879<br />
A.O. Smith Corp. 1,100 45,460 49,991<br />
Aecom Technology Corp. 6,800 221,838 195,756<br />
AGCO Corp. 1,200 39,751 40,684<br />
Aircastle Ltd. 4,100 37,262 42,338<br />
Alliant Techsystems Inc. 7,900 659,783 730,469<br />
American Science and Engineering Inc. 600 43,960 47,679<br />
Avis Budget Group Inc. 2,800 27,668 38,512<br />
BE Aerospace Inc. 1,900 28,252 46,649<br />
Boeing Co. (The) 13,600 789,718 771,191<br />
Brink’s Co. (The) 2,800 77,767 71,447<br />
Bucyrus International Inc., Class ‘A’ 400 16,809 23,638<br />
Burlington Northern Santa Fe Corp. 8,580 821,431 887,071<br />
C.H. Robinson Worldwide Inc. 15,000 888,522 923,544<br />
Carlisle Cos. Inc. 100 2,527 3,592<br />
Caterpillar Inc. 38,725 1,924,721 2,313,643<br />
Cintas Corp. 2,700 76,619 73,736<br />
Con-way Inc. 3,200 111,824 117,113<br />
Corrections Corp. of America 2,700 70,815 69,490<br />
Crane Co. 26,700 975,382 857,083<br />
CSX Corp. 5,100 202,445 259,256<br />
Cummins Inc. 43,885 1,908,666 2,109,414<br />
Danaher Corp. 31,135 2,216,434 2,454,556<br />
Deere and Co. 16,800 727,765 951,415<br />
Dover Corp. 9,900 394,307 431,856<br />
Number Average Fair<br />
of Cost Value<br />
Shares $ $<br />
Dun & Bradstreet Corp. (The) 900 81,890 79,595<br />
DynCorp International Inc., Class ‘A’ 8,800 168,554 132,386<br />
Eaton Corp. 1,100 70,154 73,366<br />
Emerson Electric Co. 41,135 1,803,664 1,837,077<br />
Ennis Inc. 1,200 18,949 21,122<br />
Expeditors International of Washington Inc. 128,700 4,598,463 4,685,864<br />
Fairchild Semiconductor International Inc., Class ‘A’ 10,200 87,274 106,825<br />
Fastenal Co. 200 8,118 8,722<br />
FedEx Corp. 17,500 1,602,836 1,528,783<br />
First Solar Inc. 400 74,124 56,779<br />
Flowserve Corp. 900 89,682 89,190<br />
Fluor Corp. 4,700 285,784 221,874<br />
Gardner Denver Inc. 15,400 689,541 686,952<br />
General Cable Corp. 1,000 32,362 30,842<br />
General Dynamics Corp. 42,900 2,821,169 3,062,744<br />
General Electric Co. 361,800 9,257,642 5,738,704<br />
Goodrich Corp. 49,000 2,707,365 3,300,468<br />
Harsco Corp. 26,800 965,174 905,527<br />
Hertz Global Holdings Inc. 5,900 49,273 73,728<br />
Honeywell International Inc. 29,600 1,141,070 1,215,801<br />
Hubbell Inc., Class ‘B’ 25,100 1,072,552 1,244,633<br />
Illinois Tool Works Inc. 8,100 367,491 407,429<br />
International Paper Co. 2,700 60,354 75,802<br />
ITT Industries Inc. 2,100 107,697 109,504<br />
J.B. Hunt Transport Services Inc. 1,200 41,604 40,596<br />
Jacobs Engineering Group Inc. 1,400 67,116 55,200<br />
Joy Global Inc. 33,365 1,690,364 1,802,427<br />
KBR Inc. 93,600 1,921,657 1,864,386<br />
Kirby Corp. 1,800 69,108 65,706<br />
L-3 Communications Holdings Inc. 31,100 2,603,790 2,834,890<br />
Lincoln Electric Holdings Inc. 900 50,699 50,440<br />
Lockheed Martin Corp. 16,500 1,377,634 1,302,349<br />
Manpower Inc. 7,300 391,147 417,698<br />
Masco Corp. 1,900 20,697 27,508<br />
McDermott International Inc. 20,300 422,491 510,118<br />
Monster Worldwide Inc. 6,300 110,989 114,722<br />
Navistar International Corp. 300 15,442 12,156<br />
Norfolk Southern Corp. 200 10,158 10,983<br />
Northrop Grumman Corp. 78,500 4,979,219 4,592,088<br />
Oshkosh Truck Corp., Class ‘B’ 35,600 1,388,002 1,382,006<br />
Owens Corning Inc. 24,800 537,564 666,616<br />
Paccar Inc. 1,400 55,326 53,248<br />
Parker Hannifin Corp. 29,885 1,750,319 1,686,804<br />
Pitney Bowes Inc. 400 11,730 9,544<br />
Precision Castparts Corp. 1,600 176,420 185,097<br />
Quanta Services Inc. 84,200 2,263,641 1,839,569<br />
R.R. Donnelley & Sons Co. 75,600 968,995 1,763,430<br />
Rayonier Inc. 1,400 59,710 61,746<br />
Raytheon Co. 83,200 4,555,979 4,493,715<br />
Robert Half International Inc. 700 16,954 19,616<br />
Rockwell Automation Inc. 5,600 238,261 275,808<br />
Rockwell Collins Inc. 4,400 216,601 255,085<br />
Roper Industries Inc. 700 35,513 38,431<br />
Ryder System Inc. 1,300 55,670 56,013<br />
Schawk Inc., Class ‘A’ 1,300 15,219 18,494<br />
SULC<br />
(See accompanying notes)<br />
24


