Annual Report - SEI
Annual Report - SEI
Annual Report - SEI
You also want an ePaper? Increase the reach of your titles
YUMPU automatically turns print PDFs into web optimized ePapers that Google loves.
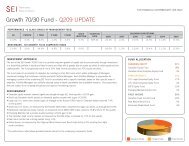
Growth 80/20 Fund<br />
Statements of Changes in Net Assets<br />
FOR THE YEARS ENDED DECEMBER 31<br />
(in thousands of dollars except per unit data)<br />
Class F<br />
Class R<br />
2009 2008 2009 2008<br />
NET ASSETS – BEGINNING OF PERIOD $ 1,621 $ 920 $ 21,147 $ —<br />
INCREASE (DECREASE) IN NET<br />
ASSETS FROM OPERATIONS 316 (569) 4,944 (4,495)<br />
DISTRIBUTIONS TO UNITHOLDERS<br />
Out of net investment income (34) (34) (729) (489)<br />
(34) (34) (729) (489)<br />
CHANGES DUE TO UNITHOLDER<br />
TRANSACTIONS<br />
Proceeds from issue of units 242 1,617 5,629 26,094<br />
Payments on redemption of units (206) (346) (3,672) (452)<br />
Reinvestment of distributions 34 33 729 489<br />
70 1,304 2,686 26,131<br />
CHANGES IN NET ASSETS 352 701 6,901 21,147<br />
NET ASSETS, END OF PERIOD $ 1,973 $ 1,621 $ 28,048 $ 21,147<br />
Class S<br />
2009 2008<br />
NET ASSETS – BEGINNING OF PERIOD $ — $ —<br />
INCREASE (DECREASE) IN NET<br />
ASSETS FROM OPERATIONS 540 —<br />
DISTRIBUTIONS TO UNITHOLDERS<br />
Out of net investment income (85) —<br />
(85) —<br />
CHANGES DUE TO UNITHOLDER<br />
TRANSACTIONS<br />
Proceeds from issue of units 4,054 —<br />
Payments on redemption of units (134) —<br />
Reinvestment of distributions 85 —<br />
4,005 —<br />
CHANGES IN NET ASSETS 4,460 —<br />
NET ASSETS, END OF PERIOD $ 4,460 $ —<br />
SBGP<br />
(See accompanying notes)<br />
173


