Canadian Equity Fund Statement of Investment Portfolio AS AT DECEMBER 31, 2009 Number Average Fair of Cost Value Shares $ $ Sun Life Financial Inc. 870,267 30,801,406 26,255,955 TMX Group Inc. 211,913 7,044,785 7,016,439 Toronto-Dominion Bank (The) 2,099,325 112,800,294 138,429,490 Western Financial Group Inc. 303,181 997,684 764,016 696,179,928 794,145,201 Health Care – 0.1% CML Healthcare Income Fund 82,047 1,117,188 1,133,069 IMRIS Inc. 220,400 1,202,318 1,146,080 2,319,506 2,279,149 Industrials – 5.8% Aecon Group Inc. 188,247 1,738,166 2,818,058 AG Growth International Inc. 57,770 1,075,944 2,010,396 Bird Construction Income Fund 70,200 2,382,824 2,410,668 Canadian National Railway Co. 421,460 19,896,965 24,086,439 Canadian Pacific Railway Ltd. 237,200 11,856,860 13,449,240 CanWel Building Materials Income Fund 189,739 745,568 781,725 CanWel Building Materials Income Fund, Subscription Receipts 157,710 599,298 599,298 Cervus Equipment Corp. 160,700 1,907,105 2,008,750 Churchill Corp. (The), Class ‘A’ 123,092 1,669,662 2,358,443 Davis + Henderson Income Fund 173,724 2,449,961 2,932,461 Flint Energy Services Ltd. 141,892 2,389,458 1,365,001 Genivar Income Fund 92,724 2,246,422 2,508,184 GLV Inc., Class ‘A’ 121,499 1,310,682 1,063,116 Richelieu Hardware Ltd. 130,478 2,597,550 2,935,755 Russel Metals Inc. 448,192 11,768,316 7,910,589 SNC-Lavalin Group Inc. 712,800 27,213,111 38,434,176 Stantec Inc. 152,549 4,173,589 4,606,980 Superior Plus Corp. 808,000 9,634,802 11,804,880 Toromont Industries Ltd. 42,000 1,101,337 1,165,080 Transat A.T. Inc., Class ‘B’ 149,950 3,268,365 3,147,450 Transcontinental Inc., Class ‘A’ 367,786 6,779,331 4,707,661 Vicwest Income Fund 68,667 820,966 1,289,566 Wajax Income Fund 234,611 3,547,550 5,088,713 WFI Industries Ltd. 104,934 1,563,578 2,675,817 122,737,410 142,158,446 Information Technology – 4.2% Absolute Software Corp. 369,400 1,950,340 1,939,350 AXIA NetMedia Corp. 647,300 972,895 996,842 CGI Group Inc., Class ‘A’ 877,800 8,831,361 12,464,760 COM DEV International Ltd. 440,100 1,471,084 1,505,142 Descartes Systems Group Inc. (The) 260,338 1,522,624 1,640,129 DragonWave Inc. 204,889 865,076 2,458,668 MacDonald, Dettwiler and Associates Ltd. 142,126 4,154,451 6,051,725 MKS Inc. 101,761 709,275 1,008,452 Open Text Corp. 70,200 3,031,044 2,993,328 Research In Motion Ltd. 830,945 56,164,986 58,963,857 Ruggedcom Inc. 86,700 1,542,863 1,557,132 SXC Health Solutions Corp. 165,375 3,374,945 9,376,762 Wi-LAN Inc. 570,416 899,263 1,494,490 85,490,207 102,450,637 Number Average Fair of Cost Value Shares $ $ Materials – 16.9% Aber Diamond Corp. 587,562 3,852,971 5,869,744 Agnico-Eagle Mines Ltd. 149,200 8,451,097 8,473,068 Agrium Inc. 180,600 9,690,032 11,686,626 Alamos Gold Inc. 1,155,004 10,642,405 14,437,550 Atrium Biotechnologies Inc. 144,633 2,074,240 2,279,416 Barrick Gold Corp. 1,556,223 63,213,109 64,427,632 Bear Creek Mining Corp. 383,842 1,445,819 1,462,438 Canam Group Inc., Class ‘A’ 91,783 809,024 647,070 Consolidated Thompson Iron Mines Ltd. 192,150 1,033,048 1,293,170 Equinox Minerals Ltd. 4,998,824 12,978,361 20,195,249 European Goldfields Ltd. 409,900 1,915,549 2,467,598 Farallon Mining Ltd. 2,831,837 1,202,964 1,557,510 FNX Mining Co. Inc. 2,371,700 30,030,182 27,298,267 Franco-Nevada Corp. 438,000 13,405,245 12,299,040 Gerdau Ameristeel Corp. 1,321,044 9,380,300 11,493,083 Goldcorp Inc. 1,121,100 44,510,684 46,312,641 Hudbay Minerals Inc. 297,000 4,772,196 4,015,440 IAMGOLD Corp. 433,800 4,663,757 7,153,362 Inmet Mining Corp. 90,500 5,727,196 5,752,180 Ivanhoe Nickel & Platinum Ltd. 41,625 497,302 260,156 Ivanhoe Nickel & Platinum Ltd., Special Warrants, 2008/11/21 114,174 982,062 856,892 Jaguar Mining Inc. 231,929 1,393,434 2,720,527 Kinross Gold Corp. 860,609 17,806,661 16,635,572 Labrador Iron Ore Royalty Income Fund 116,465 4,136,634 5,070,886 MAG Silver Corp. 244,400 1,562,700 1,534,832 Major Drilling Group International Inc. 187,726 3,631,072 5,350,191 Mercator Minerals Ltd. 1,072,860 3,241,716 2,660,693 Methanex Corp. 198,695 3,620,715 4,059,339 Northgate Minerals Corp. 716,500 1,958,982 2,292,800 Osisko Mining Corp. 190,661 932,260 1,607,272 Pan American Silver Corp. 42,700 922,499 1,067,073 Polaris Minerals Corp. 392,400 662,639 659,232 Potash Corp. of Saskatchewan Inc. 333,750 30,074,428 38,084,212 Premier Gold Mines Ltd. 625,903 1,772,750 2,603,756 Q2 Gold Resources Inc. 85,045 — — Quadra Mining Ltd. 203,131 2,516,538 2,945,400 Red Back Mining Inc. 592,700 5,032,681 8,819,376 Rubicon Minerals Corp. 872,100 4,159,552 4,308,174 San Gold Corp. 512,600 1,659,820 1,865,864 Semafo Inc. 568,424 1,132,362 2,489,697 Sherritt International Corp. 1,307,853 11,289,652 8,540,280 Silver Wheaton Corp. 603,180 8,965,729 9,524,212 Teck Resources Ltd., Class ‘B’ 769,500 20,627,360 28,240,650 Winpak Ltd. 128,913 863,909 1,097,050 Yamana Gold Inc. 611,800 7,415,855 7,317,128 366,657,491 409,732,348 Telecommunication Services – 2.3% BCE Inc. 865,918 22,990,834 25,068,326 Rogers Communications Inc., Class ‘B’ 618,900 19,926,410 20,151,384 TELUS Corp., NV 336,923 10,673,034 11,000,536 53,590,278 56,220,246 (See accompanying notes) SCEF 8
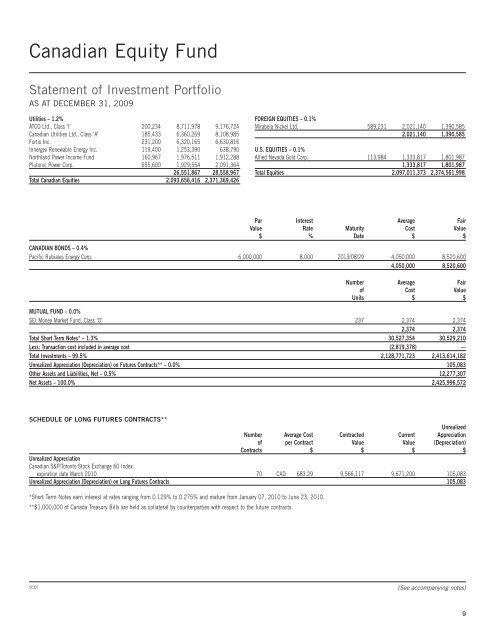
Canadian Equity Fund Statement of Investment Portfolio AS AT DECEMBER 31, 2009 Utilities – 1.2% ATCO Ltd., Class ‘I’ 200,234 8,711,978 9,176,724 Canadian Utilities Ltd., Class ‘A’ 185,433 6,360,269 8,108,985 Fortis Inc. 231,200 6,320,165 6,630,816 Innergex Renewable Energy Inc. 119,400 1,253,390 638,790 Northland Power Income Fund 160,967 1,976,511 1,912,288 Plutonic Power Corp. 655,600 1,929,554 2,091,364 26,551,867 28,558,967 Total Canadian Equities 2,093,656,416 2,371,369,426 FOREIGN EQUITIES – 0.1% Mirabela Nickel Ltd. 589,231 2,021,140 1,390,585 2,021,140 1,390,585 U.S. EQUITIES – 0.1% Allied Nevada Gold Corp. 113,984 1,333,817 1,801,987 1,333,817 1,801,987 Total Equities 2,097,011,373 2,374,561,998 Par Interest Average Fair Value Rate Maturity Cost Value $ % Date $ $ CANADIAN BONDS – 0.4% Pacific Rubiales Energy Corp. 6,000,000 8.000 2013/08/29 4,050,000 8,520,600 4,050,000 8,520,600 Number Average Fair of Cost Value Units $ $ MUTUAL FUND – 0.0% <strong>SEI</strong> Money Market Fund, Class ‘O’ 237 2,374 2,374 2,374 2,374 Total Short Term Notes* – 1.3% 30,527,354 30,529,210 Less: Transaction cost included in average cost (2,819,378) — Total Investments – 99.5% 2,128,771,723 2,413,614,182 Unrealized Appreciation (Depreciation) on Futures Contracts** – 0.0% 105,083 Other Assets and Liabilities, Net – 0.5% 12,277,307 Net Assets – 100.0% 2,425,996,572 SCHEDULE OF LONG FUTURES CONTRACTS** Unrealized Number Average Cost Contracted Current Appreciation of per Contract Value Value (Depreciation) Contracts $ $ $ $ Unrealized Appreciation Canadian S&P/Toronto Stock Exchange 60 Index expiration date March 2010 70 CAD 683.29 9,566,117 9,671,200 105,083 Unrealized Appreciation (Depreciation) on Long Futures Contracts 105,083 *Short Term Notes earn interest at rates ranging from 0.129% to 0.275% and mature from January 07, 2010 to June 23, 2010. **$1,000,000 of Canada Treasury Bills are held as collateral by counterparties with respect to the future contracts. SCEF (See accompanying notes) 9
- Page 1 and 2: Annual Report for the period ended
- Page 5: March 9, 2010 Auditors’ Report Pr
- Page 10 and 11: Canadian Equity Fund Summary of Inv
- Page 12 and 13: Canadian Equity Fund Statements of
- Page 14 and 15: Canadian Small Company Equity Fund
- Page 16 and 17: Canadian Small Company Equity Fund
- Page 18 and 19: Canadian Small Company Equity Fund
- Page 20 and 21: U.S. Large Company Equity Fund Stat
- Page 22 and 23: U.S. Large Company Equity Fund Stat
- Page 24 and 25: U.S. Large Company Equity Fund Stat
- Page 26 and 27: U.S. Large Company Equity Fund Stat
- Page 28 and 29: U.S. Large Company Equity Fund Stat
- Page 30 and 31: U.S. Large Company Equity Fund Stat
- Page 32 and 33: U.S. Small Company Equity Fund Stat
- Page 34 and 35: U.S. Small Company Equity Fund Stat
- Page 36 and 37: U.S. Small Company Equity Fund Stat
- Page 38 and 39: U.S. Small Company Equity Fund Stat
- Page 40 and 41: U.S. Small Company Equity Fund Summ
- Page 42 and 43: U.S. Small Company Equity Fund Stat
- Page 44 and 45: EAFE Equity Fund Statement of Inves
- Page 46 and 47: EAFE Equity Fund Statement of Inves
- Page 48 and 49: EAFE Equity Fund Statement of Inves
- Page 50 and 51: EAFE Equity Fund Statement of Inves
- Page 52 and 53: EAFE Equity Fund Statement of Inves
- Page 54 and 55: EAFE Equity Fund Statement of Inves
- Page 56 and 57: EAFE Equity Fund Notes to Statement
- Page 58 and 59:
EAFE Equity Fund Statements of Net
- Page 60 and 61:
Emerging Markets Equity Fund Statem
- Page 62 and 63:
Emerging Markets Equity Fund Statem
- Page 64 and 65:
Emerging Markets Equity Fund Statem
- Page 66 and 67:
Emerging Markets Equity Fund Summar
- Page 68 and 69:
Emerging Markets Equity Fund Statem
- Page 70 and 71:
Canadian Fixed Income Fund Statemen
- Page 72 and 73:
Canadian Fixed Income Fund Statemen
- Page 74 and 75:
Canadian Fixed Income Fund Statemen
- Page 76 and 77:
Canadian Fixed Income Fund Statemen
- Page 78 and 79:
Canadian Fixed Income Fund Interest
- Page 80 and 81:
Canadian Fixed Income Fund Statemen
- Page 82 and 83:
Long Duration Bond Fund Statement o
- Page 84 and 85:
Long Duration Bond Fund Statements
- Page 86 and 87:
Real Return Bond Fund Statement of
- Page 88 and 89:
Real Return Bond Fund Statements of
- Page 90 and 91:
Short Term Bond Fund Statement of I
- Page 92 and 93:
Short Term Bond Fund Notes to State
- Page 94 and 95:
Short Term Bond Fund Statements of
- Page 96 and 97:
U.S. High Yield Bond Fund Statement
- Page 98 and 99:
U.S. High Yield Bond Fund Statement
- Page 100 and 101:
U.S. High Yield Bond Fund Statement
- Page 102 and 103:
U.S. High Yield Bond Fund Statement
- Page 104 and 105:
U.S. High Yield Bond Fund Statement
- Page 106 and 107:
Money Market Fund Statement of Inve
- Page 108 and 109:
Money Market Fund Statements of Net
- Page 110 and 111:
International Synthetic Fund Statem
- Page 112 and 113:
International Synthetic Fund Notes
- Page 114 and 115:
International Synthetic Fund Statem
- Page 116 and 117:
U.S. Large Cap Synthetic Fund SCHED
- Page 118 and 119:
U.S. Large Cap Synthetic Fund State
- Page 120 and 121:
U.S. MidCap Synthetic Fund Statemen
- Page 122 and 123:
U.S. MidCap Synthetic Fund Notes to
- Page 124 and 125:
U.S. MidCap Synthetic Fund Statemen
- Page 126 and 127:
Enhanced Global Bond Fund Statement
- Page 128 and 129:
Enhanced Global Bond Fund Statement
- Page 130 and 131:
Income 100 Fund Statement of Invest
- Page 132 and 133:
Income 100 Fund Statements of Net A
- Page 134 and 135:
Income 20/80 Fund Statement of Inve
- Page 136 and 137:
Income 20/80 Fund Statements of Net
- Page 138 and 139:
Income 20/80 Fund Statements of Cha
- Page 140 and 141:
Income 30/70 Fund Notes to Statemen
- Page 142 and 143:
Income 30/70 Fund Statements of Cha
- Page 144 and 145:
Conservative Monthly Income Fund No
- Page 146 and 147:
Conservative Monthly Income Fund St
- Page 148 and 149:
Income 40/60 Fund Notes to Statemen
- Page 150 and 151:
Income 40/60 Fund Statements of Cha
- Page 152 and 153:
Balanced 50/50 Fund Statement of In
- Page 154 and 155:
Balanced 50/50 Fund Statements of N
- Page 156 and 157:
Balanced 60/40 Fund Statement of In
- Page 158 and 159:
Balanced 60/40 Fund Statements of N
- Page 160 and 161:
Balanced 60/40 Fund Statements of C
- Page 162 and 163:
Balanced Monthly Income Fund Notes
- Page 164 and 165:
Balanced Monthly Income Fund Statem
- Page 166 and 167:
Growth 70/30 Fund Notes to Statemen
- Page 168 and 169:
Growth 70/30 Fund Statements of Cha
- Page 170 and 171:
Growth 80/20 Fund Notes to Statemen
- Page 172 and 173:
Growth 80/20 Fund Statements of Cha
- Page 174 and 175:
Growth 100 Fund Statement of Invest
- Page 176 and 177:
Growth 100 Fund Statements of Net A
- Page 178 and 179:
Growth 100 Fund Statements of Chang
- Page 180 and 181:
Global Growth 100 Fund Notes to Sta
- Page 182 and 183:
Global Growth 100 Fund Statements o
- Page 184 and 185:
Notes to Financial Statements FOR T
- Page 186 and 187:
Notes to Financial Statements FOR T
- Page 188 and 189:
Notes to Financial Statements FOR T
- Page 190 and 191:
Notes to Financial Statements FOR T
- Page 192 and 193:
Notes to Financial Statements FOR T
- Page 194 and 195:
Notes to Financial Statements FOR T
- Page 196 and 197:
Notes to Financial Statements FOR T
- Page 198 and 199:
Notes to Financial Statements FOR T