

Annual Report - SEI
Annual Report - SEI
Annual Report - SEI

You also want an ePaper? Increase the reach of your titles
YUMPU automatically turns print PDFs into web optimized ePapers that Google loves.
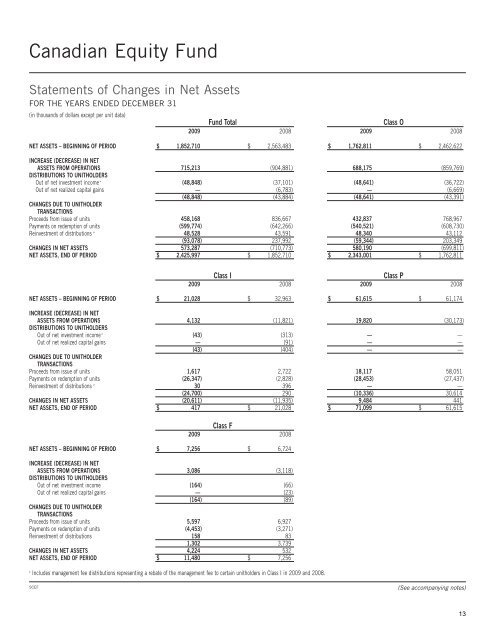
Canadian Equity Fund<br />
Statements of Changes in Net Assets<br />
FOR THE YEARS ENDED DECEMBER 31<br />
(in thousands of dollars except per unit data)<br />
Fund Total<br />
Class O<br />
2009 2008 2009 2008<br />
NET ASSETS – BEGINNING OF PERIOD $ 1,852,710 $ 2,563,483 $ 1,762,811 $ 2,462,622<br />
INCREASE (DECREASE) IN NET<br />
ASSETS FROM OPERATIONS 715,213 (904,881) 688,175 (859,769)<br />
DISTRIBUTIONS TO UNITHOLDERS<br />
Out of net investment income ≠ (48,848) (37,101) (48,641) (36,722)<br />
Out of net realized capital gains — (6,783) — (6,669)<br />
(48,848) (43,884) (48,641) (43,391)<br />
CHANGES DUE TO UNITHOLDER<br />
TRANSACTIONS<br />
Proceeds from issue of units 458,168 836,667 432,837 768,967<br />
Payments on redemption of units (599,774) (642,266) (540,521) (608,730)<br />
Reinvestment of distributions ≠ 48,528 43,591 48,340 43,112<br />
(93,078) 237,992 (59,344) 203,349<br />
CHANGES IN NET ASSETS 573,287 (710,773) 580,190 (699,811)<br />
NET ASSETS, END OF PERIOD $ 2,425,997 $ 1,852,710 $ 2,343,001 $ 1,762,811<br />
≠<br />
Includes management fee distributions representing a rebate of the management fee to certain unitholders in Class I in 2009 and 2008.<br />
Class I<br />
Class P<br />
2009 2008 2009 2008<br />
NET ASSETS – BEGINNING OF PERIOD $ 21,028 $ 32,963 $ 61,615 $ 61,174<br />
INCREASE (DECREASE) IN NET<br />
ASSETS FROM OPERATIONS 4,132 (11,821) 19,820 (30,173)<br />
DISTRIBUTIONS TO UNITHOLDERS<br />
Out of net investment income ≠ (43) (313) — —<br />
Out of net realized capital gains — (91) — —<br />
(43) (404) — —<br />
CHANGES DUE TO UNITHOLDER<br />
TRANSACTIONS<br />
Proceeds from issue of units 1,617 2,722 18,117 58,051<br />
Payments on redemption of units (26,347) (2,828) (28,453) (27,437)<br />
Reinvestment of distributions ≠ 30 396 — —<br />
(24,700) 290 (10,336) 30,614<br />
CHANGES IN NET ASSETS (20,611) (11,935) 9,484 441<br />
NET ASSETS, END OF PERIOD $ 417 $ 21,028 $ 71,099 $ 61,615<br />
Class F<br />
2009 2008<br />
NET ASSETS – BEGINNING OF PERIOD $ 7,256 $ 6,724<br />
INCREASE (DECREASE) IN NET<br />
ASSETS FROM OPERATIONS 3,086 (3,118)<br />
DISTRIBUTIONS TO UNITHOLDERS<br />
Out of net investment income (164) (66)<br />
Out of net realized capital gains — (23)<br />
(164) (89)<br />
CHANGES DUE TO UNITHOLDER<br />
TRANSACTIONS<br />
Proceeds from issue of units 5,597 6,927<br />
Payments on redemption of units (4,453) (3,271)<br />
Reinvestment of distributions 158 83<br />
1,302 3,739<br />
CHANGES IN NET ASSETS 4,224 532<br />
NET ASSETS, END OF PERIOD $ 11,480 $ 7,256<br />
SCEF<br />
(See accompanying notes)<br />
13


