

Annual Report - SEI
Annual Report - SEI
Annual Report - SEI

You also want an ePaper? Increase the reach of your titles
YUMPU automatically turns print PDFs into web optimized ePapers that Google loves.
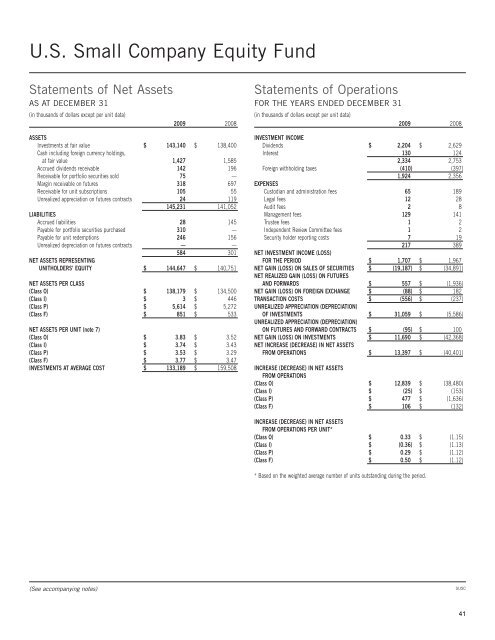
U.S. Small Company Equity Fund<br />
Statements of Net Assets<br />
AS AT DECEMBER 31<br />
(in thousands of dollars except per unit data)<br />
2009 2008<br />
ASSETS<br />
Investments at fair value $ 143,140 $ 138,400<br />
Cash including foreign currency holdings,<br />
at fair value 1,427 1,585<br />
Accrued dividends receivable 142 196<br />
Receivable for portfolio securities sold 75 —<br />
Margin receivable on futures 318 697<br />
Receivable for unit subscriptions 105 55<br />
Unrealized appreciation on futures contracts 24 119<br />
145,231 141,052<br />
LIABILITIES<br />
Accrued liabilities 28 145<br />
Payable for portfolio securities purchased 310 —<br />
Payable for unit redemptions 246 156<br />
Unrealized depreciation on futures contracts — —<br />
584 301<br />
NET ASSETS REPRESENTING<br />
UNITHOLDERS’ EQUITY $ 144,647 $ 140,751<br />
NET ASSETS PER CLASS<br />
(Class O) $ 138,179 $ 134,500<br />
(Class I) $ 3 $ 446<br />
(Class P) $ 5,614 $ 5,272<br />
(Class F) $ 851 $ 533<br />
NET ASSETS PER UNIT (note 7)<br />
(Class O) $ 3.83 $ 3.52<br />
(Class I) $ 3.74 $ 3.43<br />
(Class P) $ 3.53 $ 3.29<br />
(Class F) $ 3.77 $ 3.47<br />
INVESTMENTS AT AVERAGE COST $ 133,189 $ 159,508<br />
Statements of Operations<br />
FOR THE YEARS ENDED DECEMBER 31<br />
(in thousands of dollars except per unit data)<br />
2009 2008<br />
INVESTMENT INCOME<br />
Dividends $ 2,204 $ 2,629<br />
Interest 130 124<br />
2,334 2,753<br />
Foreign withholding taxes (410) (397)<br />
1,924 2,356<br />
EXPENSES<br />
Custodian and administration fees 65 189<br />
Legal fees 12 28<br />
Audit fees 2 8<br />
Management fees 129 141<br />
Trustee fees 1 2<br />
Independent Review Committee fees 1 2<br />
Security holder reporting costs 7 19<br />
217 389<br />
NET INVESTMENT INCOME (LOSS)<br />
FOR THE PERIOD $ 1,707 $ 1,967<br />
NET GAIN (LOSS) ON SALES OF SECURITIES $ (19,187) $ (34,891)<br />
NET REALIZED GAIN (LOSS) ON FUTURES<br />
AND FORWARDS $ 557 $ (1,936)<br />
NET GAIN (LOSS) ON FOREIGN EXCHANGE $ (88) $ 182<br />
TRANSACTION COSTS $ (556) $ (237)<br />
UNREALIZED APPRECIATION (DEPRECIATION)<br />
OF INVESTMENTS $ 31,059 $ (5,586)<br />
UNREALIZED APPRECIATION (DEPRECIATION)<br />
ON FUTURES AND FORWARD CONTRACTS $ (95) $ 100<br />
NET GAIN (LOSS) ON INVESTMENTS $ 11,690 $ (42,368)<br />
NET INCREASE (DECREASE) IN NET ASSETS<br />
FROM OPERATIONS $ 13,397 $ (40,401)<br />
INCREASE (DECREASE) IN NET ASSETS<br />
FROM OPERATIONS<br />
(Class O) $ 12,839 $ (38,480)<br />
(Class I) $ (25) $ (153)<br />
(Class P) $ 477 $ (1,636)<br />
(Class F) $ 106 $ (132)<br />
INCREASE (DECREASE) IN NET ASSETS<br />
FROM OPERATIONS PER UNIT*<br />
(Class O) $ 0.33 $ (1.15)<br />
(Class I) $ (0.36) $ (1.13)<br />
(Class P) $ 0.29 $ (1.12)<br />
(Class F) $ 0.50 $ (1.12)<br />
* Based on the weighted average number of units outstanding during the period.<br />
(See accompanying notes)<br />
SUSC<br />
41


