

Annual Report - SEI
Annual Report - SEI
Annual Report - SEI

Create successful ePaper yourself
Turn your PDF publications into a flip-book with our unique Google optimized e-Paper software.
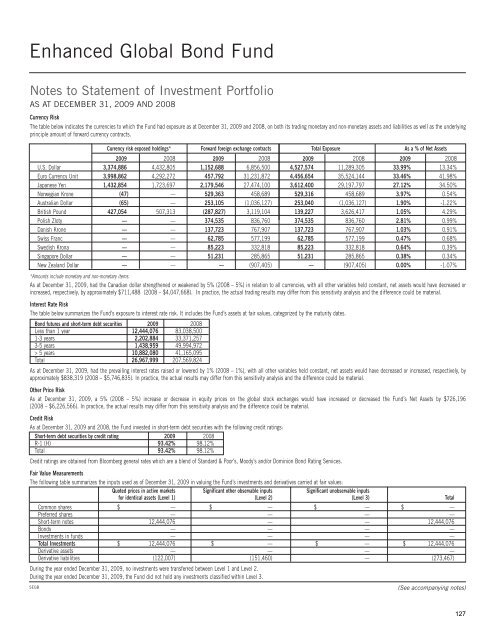
Enhanced Global Bond Fund<br />
Notes to Statement of Investment Portfolio<br />
AS AT DECEMBER 31, 2009 AND 2008<br />
Currency Risk<br />
The table below indicates the currencies to which the Fund had exposure as at December 31, 2009 and 2008, on both its trading monetary and non-monetary assets and liabilities as well as the underlying<br />
principle amount of forward currency contracts.<br />
Currency risk exposed holdings* Forward foreign exchange contracts Total Exposure As a % of Net Assets<br />
2009 2008 2009 2008 2009 2008 2009 2008<br />
U.S. Dollar 3,374,886 4,432,805 1,152,688 6,856,500 4,527,574 11,289,305 33.99% 13.34%<br />
Euro Currency Unit 3,998,862 4,292,272 457,792 31,231,872 4,456,654 35,524,144 33.46% 41.98%<br />
Japanese Yen 1,432,854 1,723,697 2,179,546 27,474,100 3,612,400 29,197,797 27.12% 34.50%<br />
Norwegian Krone (47) — 529,363 458,689 529,316 458,689 3.97% 0.54%<br />
Australian Dollar (65) — 253,105 (1,036,127) 253,040 (1,036,127) 1.90% -1.22%<br />
British Pound 427,054 507,313 (287,827) 3,119,104 139,227 3,626,417 1.05% 4.29%<br />
Polish Zloty — — 374,535 836,760 374,535 836,760 2.81% 0.99%<br />
Danish Krone — — 137,723 767,907 137,723 767,907 1.03% 0.91%<br />
Swiss Franc — — 62,785 577,199 62,785 577,199 0.47% 0.68%<br />
Swedish Krona — — 85,223 332,818 85,223 332,818 0.64% 0.39%<br />
Singapore Dollar — — 51,231 285,865 51,231 285,865 0.38% 0.34%<br />
New Zealand Dollar — — — (907,405) — (907,405) 0.00% -1.07%<br />
*Amounts include monetary and non-monetary items.<br />
As at December 31, 2009, had the Canadian dollar strengthened or weakened by 5% (2008 – 5%) in relation to all currencies, with all other variables held constant, net assets would have decreased or<br />
increased, respectively, by approximately $711,488 (2008 – $4,047,668). In practice, the actual trading results may differ from this sensitivity analysis and the difference could be material.<br />
Interest Rate Risk<br />
The table below summarizes the Fund’s exposure to interest rate risk. It includes the Fund’s assets at fair values, categorized by the maturity dates.<br />
Bond futures and short-term debt securities 2009 2008<br />
Less than 1 year 12,444,076 83,038,500<br />
1-3 years 2,202,884 33,371,257<br />
3-5 years 1,438,959 49,994,972<br />
> 5 years 10,882,080 41,165,095<br />
Total 26,967,999 207,569,824<br />
As at December 31, 2009, had the prevailing interest rates raised or lowered by 1% (2008 – 1%), with all other variables held constant, net assets would have decreased or increased, respectively, by<br />
approximately $838,319 (2008 – $5,746,835). In practice, the actual results may differ from this sensitivity analysis and the difference could be material.<br />
Other Price Risk<br />
As at December 31, 2009, a 5% (2008 – 5%) increase or decrease in equity prices on the global stock exchanges would have increased or decreased the Fund’s Net Assets by $726,196<br />
(2008 – $6,226,566). In practice, the actual results may differ from this sensitivity analysis and the difference could be material.<br />
Credit Risk<br />
As at December 31, 2009 and 2008, the Fund invested in short-term debt securities with the following credit ratings:<br />
Short-term debt securities by credit rating 2009 2008<br />
R-1 (H) 93.42% 98.12%<br />
Total 93.42% 98.12%<br />
Credit ratings are obtained from Bloomberg general rates which are a blend of Standard & Poor’s, Moody’s and/or Dominion Bond Rating Services.<br />
Fair Value Measurements<br />
The following table summarizes the inputs used as of December 31, 2009 in valuing the Fund’s investments and derivatives carried at fair values:<br />
Quoted prices in active markets Significant other observable inputs Significant unobservable inputs<br />
for identical assets (Level 1) (Level 2) (Level 3) Total<br />
Common shares $ — $ — $ — $ —<br />
Preferred shares — — — —<br />
Short-term notes 12,444,076 — — 12,444,076<br />
Bonds — — — —<br />
Investments in funds — — — —<br />
Total Investments $ 12,444,076 $ — $ — $ 12,444,076<br />
Derivative assets — — — —<br />
Derivative liabilities (122,007) (151,460) — (273,467)<br />
During the year ended December 31, 2009, no investments were transferred between Level 1 and Level 2.<br />
During the year ended December 31, 2009, the Fund did not hold any investments classified within Level 3.<br />
SEGB<br />
(See accompanying notes)<br />
127


