

Annual Report - SEI
Annual Report - SEI
Annual Report - SEI

Create successful ePaper yourself
Turn your PDF publications into a flip-book with our unique Google optimized e-Paper software.
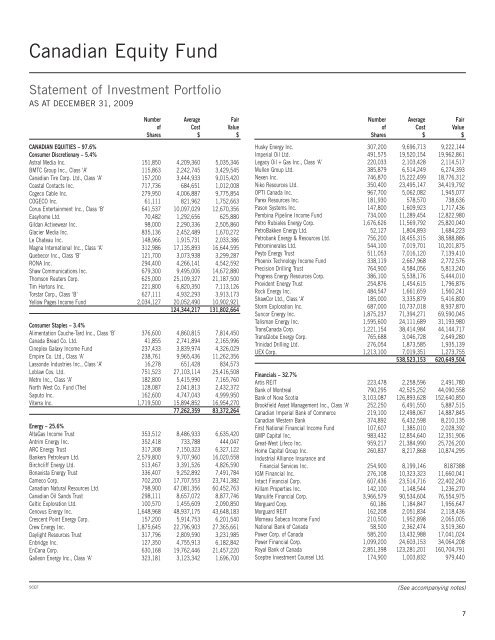
Canadian Equity Fund<br />
Statement of Investment Portfolio<br />
AS AT DECEMBER 31, 2009<br />
Number Average Fair<br />
of Cost Value<br />
Shares $ $<br />
CANADIAN EQUITIES – 97.6%<br />
Consumer Discretionary – 5.4%<br />
Astral Media Inc. 151,850 4,209,360 5,035,346<br />
BMTC Group Inc., Class ‘A’ 115,863 2,242,745 3,429,545<br />
Canadian Tire Corp. Ltd., Class ‘A’ 157,200 3,444,933 9,015,420<br />
Coastal Contacts Inc. 717,736 684,651 1,012,008<br />
Cogeco Cable Inc. 279,950 4,006,887 9,775,854<br />
COGECO Inc. 61,111 821,962 1,752,663<br />
Corus Entertainment Inc., Class ‘B’ 641,537 10,097,029 12,670,356<br />
Easyhome Ltd. 70,482 1,292,656 625,880<br />
Gildan Activewear Inc. 98,000 2,290,336 2,505,860<br />
Glacier Media Inc. 835,136 2,452,489 1,670,272<br />
Le Chateau Inc. 148,966 1,915,731 2,033,386<br />
Magna International Inc., Class ‘A’ 312,986 17,135,893 16,644,595<br />
Quebecor Inc., Class ‘B’ 121,700 3,073,938 3,299,287<br />
RONA Inc. 294,400 4,266,141 4,542,592<br />
Shaw Communications Inc. 679,300 9,495,006 14,672,880<br />
Thomson Reuters Corp. 625,000 25,109,327 21,187,500<br />
Tim Hortons Inc. 221,800 6,820,350 7,113,126<br />
Torstar Corp., Class ‘B’ 627,111 4,932,293 3,913,173<br />
Yellow Pages Income Fund 2,034,127 20,052,490 10,902,921<br />
124,344,217 131,802,664<br />
Consumer Staples – 3.4%<br />
Alimentation Couche-Tard Inc., Class ‘B’ 376,600 4,860,815 7,814,450<br />
Canada Bread Co. Ltd. 41,855 2,741,894 2,165,996<br />
Cineplex Galaxy Income Fund 237,433 3,839,974 4,326,029<br />
Empire Co. Ltd., Class ‘A’ 238,761 9,965,436 11,262,356<br />
Lassonde Industries Inc., Class ‘A’ 16,278 651,428 834,573<br />
Loblaw Cos. Ltd. 751,523 27,103,114 25,416,508<br />
Metro Inc., Class ‘A’ 182,800 5,415,990 7,165,760<br />
North West Co. Fund (The) 128,087 2,041,813 2,432,372<br />
Saputo Inc. 162,600 4,747,043 4,999,950<br />
Viterra Inc. 1,719,500 15,894,852 16,954,270<br />
77,262,359 83,372,264<br />
Energy – 25.6%<br />
AltaGas Income Trust 353,512 8,486,933 6,635,420<br />
Antrim Energy Inc. 352,418 733,788 444,047<br />
ARC Energy Trust 317,308 7,150,323 6,327,122<br />
Bankers Petroleum Ltd. 2,579,800 9,707,960 16,020,558<br />
Birchcliff Energy Ltd. 513,467 3,391,526 4,826,590<br />
Bonavista Energy Trust 336,407 9,252,892 7,491,784<br />
Cameco Corp. 702,200 17,707,553 23,741,382<br />
Canadian Natural Resources Ltd. 798,900 47,081,356 60,452,763<br />
Canadian Oil Sands Trust 298,111 8,657,072 8,877,746<br />
Celtic Exploration Ltd. 100,570 1,455,609 2,090,850<br />
Cenovus Energy Inc. 1,648,968 48,937,175 43,648,183<br />
Crescent Point Energy Corp. 157,200 5,914,753 6,201,540<br />
Crew Energy Inc. 1,875,645 22,796,903 27,365,661<br />
Daylight Resources Trust 317,796 2,809,590 3,231,985<br />
Enbridge Inc. 127,350 4,755,913 6,182,842<br />
EnCana Corp. 630,168 19,762,446 21,457,220<br />
Galleon Energy Inc., Class ‘A’ 323,181 3,123,342 1,696,700<br />
Number Average Fair<br />
of Cost Value<br />
Shares $ $<br />
Husky Energy Inc. 307,200 9,696,713 9,222,144<br />
Imperial Oil Ltd. 491,575 19,520,154 19,962,861<br />
Legacy Oil + Gas Inc., Class ‘A’ 220,033 2,103,428 2,114,517<br />
Mullen Group Ltd. 385,879 6,514,249 6,274,393<br />
Nexen Inc. 746,870 15,222,499 18,776,312<br />
Niko Resources Ltd. 350,400 23,495,147 34,419,792<br />
OPTI Canada Inc. 967,700 5,062,082 1,945,077<br />
Parex Resources Inc. 181,930 578,570 738,636<br />
Pason Systems Inc. 147,800 1,609,923 1,717,436<br />
Pembina Pipeline Income Fund 734,000 11,289,454 12,822,980<br />
Petro Rubiales Energy Corp. 1,676,626 11,569,792 25,820,040<br />
PetroBakken Energy Ltd. 52,127 1,804,893 1,684,223<br />
Petrobank Energy & Resources Ltd. 756,200 18,455,315 38,588,886<br />
Petrominerales Ltd. 544,100 7,019,701 10,201,875<br />
Peyto Energy Trust 511,053 7,016,120 7,139,410<br />
Phoenix Technology Income Fund 338,119 2,667,968 2,772,576<br />
Precision Drilling Trust 764,900 4,584,056 5,813,240<br />
Progress Energy Resources Corp. 386,100 5,538,176 5,444,010<br />
Provident Energy Trust 254,876 1,454,615 1,796,876<br />
Rock Energy Inc. 484,547 1,661,659 1,560,241<br />
ShawCor Ltd., Class ‘A’ 185,000 3,335,879 5,416,800<br />
Storm Exploration Inc. 687,000 10,737,018 8,937,870<br />
Suncor Energy Inc. 1,875,237 71,394,271 69,590,045<br />
Talisman Energy Inc. 1,595,600 24,111,689 31,193,980<br />
TransCanada Corp. 1,221,154 38,414,984 44,144,717<br />
TransGlobe Energy Corp. 765,688 3,046,728 2,649,280<br />
Trinidad Drilling Ltd. 276,054 1,873,585 1,935,139<br />
UEX Corp. 1,213,100 7,019,351 1,273,755<br />
538,523,153 620,649,504<br />
Financials – 32.7%<br />
Artis REIT 223,478 2,258,596 2,491,780<br />
Bank of Montreal 790,295 42,525,252 44,090,558<br />
Bank of Nova Scotia 3,103,087 126,893,628 152,640,850<br />
Brookfield Asset Management Inc., Class ‘A’ 252,250 6,491,550 5,887,515<br />
Canadian Imperial Bank of Commerce 219,100 12,498,067 14,887,845<br />
Canadian Western Bank 374,892 6,432,598 8,210,135<br />
First National Financial Income Fund 107,607 1,385,010 2,028,392<br />
GMP Capital Inc. 983,432 12,854,640 12,351,906<br />
Great-West Lifeco Inc. 959,217 21,384,990 25,726,200<br />
Home Capital Group Inc. 260,837 8,217,868 10,874,295<br />
Industrial Alliance Insurance and<br />
Financial Services Inc. 254,900 8,199,146 8187388<br />
IGM Financial Inc. 276,108 10,323,323 11,660,041<br />
Intact Financial Corp. 607,436 23,514,716 22,402,240<br />
Killam Properties Inc. 142,100 1,148,544 1,236,270<br />
Manulife Financial Corp. 3,966,579 90,534,604 76,554,975<br />
Morguard Corp. 60,186 1,184,847 1,956,647<br />
Morguard REIT 162,208 2,051,834 2,118,436<br />
Morneau Sobeco Income Fund 210,500 1,952,898 2,065,005<br />
National Bank of Canada 58,500 2,362,474 3,519,360<br />
Power Corp. of Canada 585,200 13,432,988 17,041,024<br />
Power Financial Corp. 1,099,200 24,603,153 34,064,208<br />
Royal Bank of Canada 2,851,398 123,281,201 160,704,791<br />
Sceptre Investment Counsel Ltd. 174,900 1,003,832 979,440<br />
SCEF<br />
(See accompanying notes)<br />
7


