Standardbank Cover.indd - Standard Bank - Investor Relations
Standardbank Cover.indd - Standard Bank - Investor Relations
Standardbank Cover.indd - Standard Bank - Investor Relations

Create successful ePaper yourself
Turn your PDF publications into a flip-book with our unique Google optimized e-Paper software.
Group results<br />
in brief<br />
Segmental<br />
reporting<br />
Income statement<br />
analysis<br />
Balance sheet<br />
analysis<br />
Capital<br />
management<br />
Key banking legal<br />
entity information<br />
Other information<br />
and restatements<br />
Shareholder<br />
information<br />
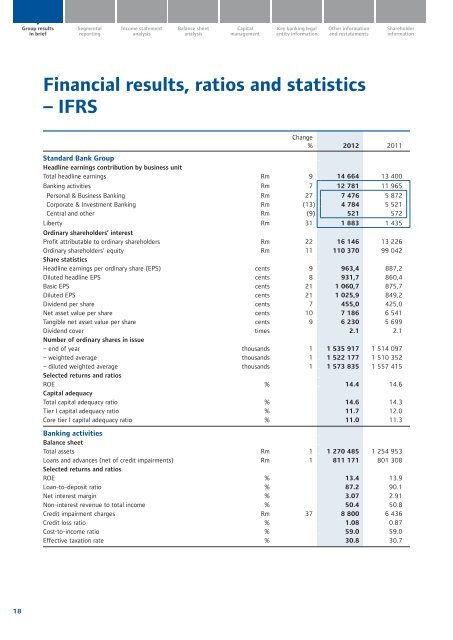
Financial results, ratios and statistics<br />
– IFRS<br />
Change<br />
% 2012 2011<br />
<strong>Standard</strong> <strong>Bank</strong> Group<br />
Headline earnings contribution by business unit<br />
Total headline earnings Rm 9 14 664 13 400<br />
<strong>Bank</strong>ing activities Rm 7 12 781 11 965<br />
Personal & Business <strong>Bank</strong>ing Rm 27 7 476 5 872<br />
Corporate & Investment <strong>Bank</strong>ing Rm (13) 4 784 5 521<br />
Central and other Rm (9) 521 572<br />
Liberty Rm 31 1 883 1 435<br />
Ordinary shareholders’ interest<br />
Profit attributable to ordinary shareholders Rm 22 16 146 13 226<br />
Ordinary shareholders’ equity Rm 11 110 370 99 042<br />
Share statistics<br />
Headline earnings per ordinary share (EPS) cents 9 963,4 887,2<br />
Diluted headline EPS cents 8 931,7 860,4<br />
Basic EPS cents 21 1 060,7 875,7<br />
Diluted EPS cents 21 1 025,9 849,2<br />
Dividend per share cents 7 455,0 425,0<br />
Net asset value per share cents 10 7 186 6 541<br />
Tangible net asset value per share cents 9 6 230 5 699<br />
Dividend cover times 2.1 2.1<br />
Number of ordinary shares in issue<br />
– end of year thousands 1 1 535 917 1 514 097<br />
– weighted average thousands 1 1 522 177 1 510 352<br />
– diluted weighted average thousands 1 1 573 835 1 557 415<br />
Selected returns and ratios<br />
ROE % 14.4 14.6<br />
Capital adequacy<br />
Total capital adequacy ratio % 14.6 14.3<br />
Tier I capital adequacy ratio % 11.7 12.0<br />
Core tier I capital adequacy ratio % 11.0 11.3<br />
<strong>Bank</strong>ing activities<br />
Balance sheet<br />
Total assets Rm 1 1 270 485 1 254 953<br />
Loans and advances (net of credit impairments) Rm 1 811 171 801 308<br />
Selected returns and ratios<br />
ROE % 13.4 13.9<br />
Loan-to-deposit ratio % 87.2 90.1<br />
Net interest margin % 3.07 2.91<br />
Non-interest revenue to total income % 50.4 50.8<br />
Credit impairment charges Rm 37 8 800 6 436<br />
Credit loss ratio % 1.08 0.87<br />
Cost-to-income ratio % 59.0 59.0<br />
Effective taxation rate % 30.8 30.7<br />
18