Standardbank Cover.indd - Standard Bank - Investor Relations
Standardbank Cover.indd - Standard Bank - Investor Relations
Standardbank Cover.indd - Standard Bank - Investor Relations

Create successful ePaper yourself
Turn your PDF publications into a flip-book with our unique Google optimized e-Paper software.
Group results<br />
in brief<br />
Segmental<br />
reporting<br />
Income statement<br />
analysis<br />
Balance sheet<br />
analysis<br />
Capital<br />
management<br />
Key banking legal<br />
entity information<br />
Other information<br />
and restatements<br />
Shareholder<br />
information<br />
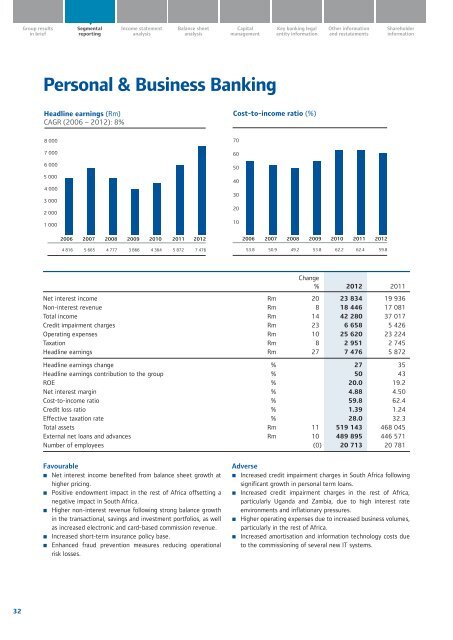
Personal & Business <strong>Bank</strong>ing<br />
Headline earnings (Rm)<br />
CAGR (2006 – 2012): 8%<br />
Cost-to-income ratio (%)<br />
8 000<br />
7 000<br />
6 000<br />
5 000<br />
4 000<br />
3 000<br />
2 000<br />
1 000<br />
70<br />
60<br />
50<br />
40<br />
30<br />
20<br />
10<br />
2006<br />
2007<br />
2008<br />
2009<br />
2010<br />
2011<br />
2012<br />
2006<br />
2007<br />
2008<br />
2009<br />
2010<br />
2011<br />
2012<br />
4 816 5 665 4 777 3 866 4 364 5 872 7 476<br />
53.8 50.9 49.2 53.8 62.2 62.4 59.8<br />
Change<br />
% 2012 2011<br />
Net interest income Rm 20 23 834 19 936<br />
Non-interest revenue Rm 8 18 446 17 081<br />
Total income Rm 14 42 280 37 017<br />
Credit impairment charges Rm 23 6 658 5 426<br />
Operating expenses Rm 10 25 620 23 224<br />
Taxation Rm 8 2 951 2 745<br />
Headline earnings Rm 27 7 476 5 872<br />
Headline earnings change % 27 35<br />
Headline earnings contribution to the group % 50 43<br />
ROE % 20.0 19.2<br />
Net interest margin % 4.88 4.50<br />
Cost-to-income ratio % 59.8 62.4<br />
Credit loss ratio % 1.39 1.24<br />
Effective taxation rate % 28.0 32.3<br />
Total assets Rm 11 519 143 468 045<br />
External net loans and advances Rm 10 489 895 446 571<br />
Number of employees (0) 20 713 20 781<br />
Favourable<br />
• Net interest income benefited from balance sheet growth at<br />
higher pricing.<br />
• Positive endowment impact in the rest of Africa offsetting a<br />
negative impact in South Africa.<br />
• Higher non-interest revenue following strong balance growth<br />
in the transactional, savings and investment portfolios, as well<br />
as increased electronic and card-based commission revenue.<br />
• Increased short-term insurance policy base.<br />
• Enhanced fraud prevention measures reducing operational<br />
risk losses.<br />
Adverse<br />
• Increased credit impairment charges in South Africa following<br />
significant growth in personal term loans.<br />
• Increased credit impairment charges in the rest of Africa,<br />
particularly Uganda and Zambia, due to high interest rate<br />
environments and inflationary pressures.<br />
• Higher operating expenses due to increased business volumes,<br />
particularly in the rest of Africa.<br />
• Increased amortisation and information technology costs due<br />
to the commissioning of several new IT systems.<br />
32