Standardbank Cover.indd - Standard Bank - Investor Relations
Standardbank Cover.indd - Standard Bank - Investor Relations
Standardbank Cover.indd - Standard Bank - Investor Relations

Create successful ePaper yourself
Turn your PDF publications into a flip-book with our unique Google optimized e-Paper software.
<strong>Standard</strong> <strong>Bank</strong> Group Analysis of financial results for the year ended 31 December 2012<br />
Highlights<br />
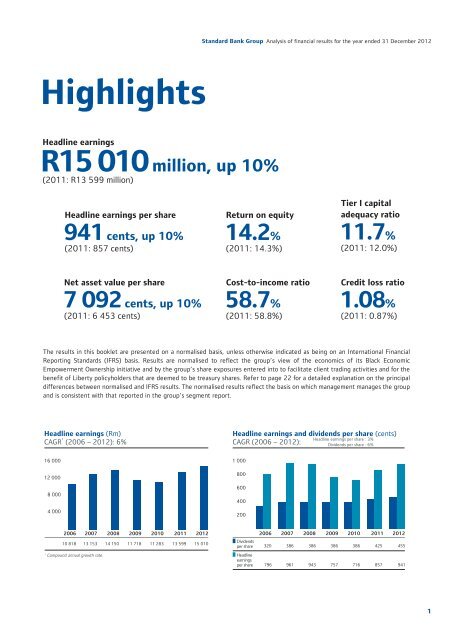
Headline earnings<br />
R15 010 million, up 10%<br />
(2011: R13 599 million)<br />
Headline earnings per share<br />
941 cents, up 10%<br />
(2011: 857 cents)<br />
Return on equity<br />
14.2%<br />
(2011: 14.3%)<br />
Tier I capital<br />
adequacy ratio<br />
11.7%<br />
(2011: 12.0%)<br />
Net asset value per share<br />
7 092 cents, up 10%<br />
(2011: 6 453 cents)<br />
Cost-to-income ratio<br />
58.7%<br />
(2011: 58.8%)<br />
Credit loss ratio<br />
1.08%<br />
(2011: 0.87%)<br />
The results in this booklet are presented on a normalised basis, unless otherwise indicated as being on an International Financial<br />
Reporting <strong>Standard</strong>s (IFRS) basis. Results are normalised to reflect the group’s view of the economics of its Black Economic<br />
Empowerment Ownership initiative and by the group’s share exposures entered into to facilitate client trading activities and for the<br />
benefit of Liberty policyholders that are deemed to be treasury shares. Refer to page 22 for a detailed explanation on the principal<br />
differences between normalised and IFRS results. The normalised results reflect the basis on which management manages the group<br />
and is consistent with that reported in the group’s segment report.<br />
Headline earnings (Rm)<br />
CAGR<br />
1<br />
(2006 – 2012): 6%<br />
Headline earnings and dividends per share (cents)<br />
CAGR (2006 – 2012):<br />
Headline earnings per share : 3%<br />
Dividends per share : 6%<br />
16 000<br />
12 000<br />
8 000<br />
4 000<br />
1 000<br />
800<br />
600<br />
400<br />
200<br />
2006 2007 2008 2009 2010 2011 2012<br />
10 818 13 153 14 150 11 718 11 283 13 599 15 010<br />
1<br />
Compound annual growth rate.<br />
Dividends<br />
per share<br />
Headline<br />
earnings<br />
per share<br />
2006 2007 2008 2009 2010 2011 2012<br />
320 386 386 386 386 425 455<br />
796 961 943 757 716 857 941<br />
1