Standardbank Cover.indd - Standard Bank - Investor Relations
Standardbank Cover.indd - Standard Bank - Investor Relations
Standardbank Cover.indd - Standard Bank - Investor Relations

Create successful ePaper yourself
Turn your PDF publications into a flip-book with our unique Google optimized e-Paper software.
Group results<br />
in brief<br />
Segmental<br />
reporting<br />
Income statement<br />
analysis<br />
Balance sheet<br />
analysis<br />
Capital<br />
management<br />
Key banking legal<br />
entity information<br />
Other information<br />
and restatements<br />
Shareholder<br />
information<br />
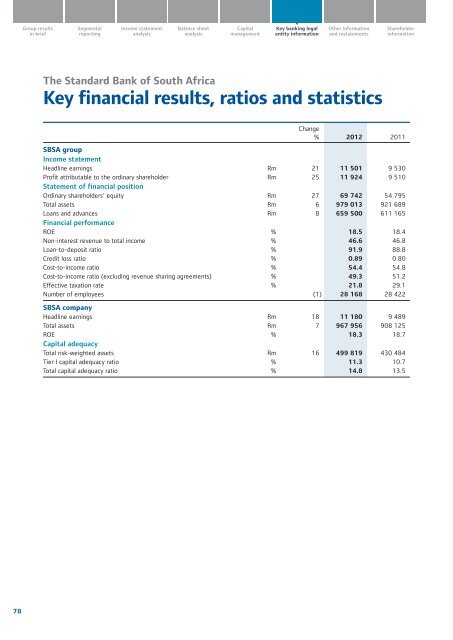
The <strong>Standard</strong> <strong>Bank</strong> of South Africa<br />
Key financial results, ratios and statistics<br />
Change<br />
% 2012 2011<br />
SBSA group<br />
Income statement<br />
Headline earnings Rm 21 11 501 9 530<br />
Profit attributable to the ordinary shareholder Rm 25 11 924 9 510<br />
Statement of financial position<br />
Ordinary shareholders’ equity Rm 27 69 742 54 795<br />
Total assets Rm 6 979 013 921 689<br />
Loans and advances Rm 8 659 500 611 165<br />
Financial performance<br />
ROE % 18.5 18.4<br />
Non-interest revenue to total income % 46.6 46.8<br />
Loan-to-deposit ratio % 91.9 88.8<br />
Credit loss ratio % 0.89 0.80<br />
Cost-to-income ratio % 54.4 54.8<br />
Cost-to-income ratio (excluding revenue sharing agreements) % 49.3 51.2<br />
Effective taxation rate % 21.8 29.1<br />
Number of employees (1) 28 168 28 422<br />
SBSA company<br />
Headline earnings Rm 18 11 180 9 489<br />
Total assets Rm 7 967 956 908 125<br />
ROE % 18.3 18.7<br />
Capital adequacy<br />
Total risk-weighted assets Rm 16 499 819 430 484<br />
Tier I capital adequacy ratio % 11.3 10.7<br />
Total capital adequacy ratio % 14.8 13.5<br />
78