Standardbank Cover.indd - Standard Bank - Investor Relations
Standardbank Cover.indd - Standard Bank - Investor Relations
Standardbank Cover.indd - Standard Bank - Investor Relations

Create successful ePaper yourself
Turn your PDF publications into a flip-book with our unique Google optimized e-Paper software.
<strong>Standard</strong> <strong>Bank</strong> Group Analysis of financial results for the year ended 31 December 2012<br />
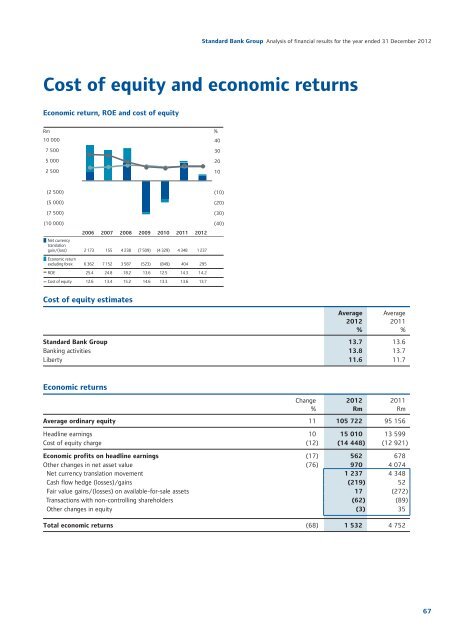
Cost of equity and economic returns<br />
Economic return, ROE and cost of equity<br />
Rm %<br />
10 000<br />
40<br />
7 500<br />
30<br />
5 000<br />
20<br />
2 500<br />
10<br />
(2 500)<br />
(5 000)<br />
(7 500)<br />
(10 000)<br />
2006<br />
2007<br />
2008<br />
2009<br />
2010<br />
2011<br />
2012<br />
Net currency<br />
translation<br />
gain/(loss) 2 173 155 4 238 (7 509) (4 329) 4 348 1 237<br />
Economic return<br />
excluding forex 6 362 7 152 3 587 (523) (849) 404 295<br />
ROE 25.4 24.8 18.2 13.6 12.5 14.3 14.2<br />
Cost of equity 12.6 13.4 15.2 14.6 13.3 13.6 13.7<br />
(10)<br />
(20)<br />
(30)<br />
(40)<br />
Cost of equity estimates<br />
Average<br />
2012<br />
%<br />
Average<br />
2011<br />
%<br />
<strong>Standard</strong> <strong>Bank</strong> Group 13.7 13.6<br />
<strong>Bank</strong>ing activities 13.8 13.7<br />
Liberty 11.6 11.7<br />
Economic returns<br />
Change<br />
%<br />
Average ordinary equity 11 105 722 95 156<br />
Headline earnings 10 15 010 13 599<br />
Cost of equity charge (12) (14 448) (12 921)<br />
Economic profits on headline earnings (17) 562 678<br />
Other changes in net asset value (76) 970 4 074<br />
Net currency translation movement 1 237 4 348<br />
Cash flow hedge (losses)/gains (219) 52<br />
Fair value gains/(losses) on available-for-sale assets 17 (272)<br />
Transactions with non-controlling shareholders (62) (89)<br />
Other changes in equity (3) 35<br />
Total economic returns (68) 1 532 4 752<br />
2012<br />
Rm<br />
2011<br />
Rm<br />
67