
You also want an ePaper? Increase the reach of your titles
YUMPU automatically turns print PDFs into web optimized ePapers that Google loves.
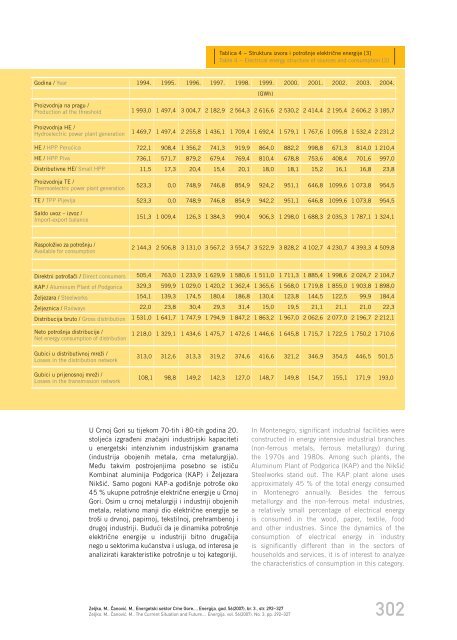
Tablica 4 − Struktura izvora i potroπnje elektriËne energije [3]<br />
Table 4 − Electrical energy structure of sources and consumption [3]<br />
Godina / Year<br />
Proizvodnja na pragu /<br />
Production at the threshold<br />
1994. 1995. 1996. 1997. 1998. 1999. 2000. 2001. 2002. 2003. 2004.<br />
(GWh)<br />
1 993,0 1 497,4 3 004,7 2 182,9 2 564,3 2 616,6 2 530,2 2 414,4 2 195,4 2 606,2 3 185,7<br />
Proizvodnja HE /<br />
Hydroelectric power plant generation<br />
HE / HPP PeruÊica<br />
HE / HPP Piva<br />
Distributivne HE/ Small HPP<br />
Proizvodnja TE /<br />
Thermoelectric power plant generation<br />
TE / TPP Pljevlja<br />
Saldo uvoz ∑ izvoz /<br />
Import-export balance<br />
1 469,7 1 497,4 2 255,8 1 436,1 1 709,4 1 692,4 1 579,1 1 767,6 1 095,8 1 532,4 2 231,2<br />
722,1 908,4 1 356,2 741,3 919,9 864,0 882,2 998,8 671,3 814,0 1 210,4<br />
736,1 571,7 879,2 679,4 769,4 810,4 678,8 753,6 408,4 701,6 997,0<br />
11,5 17,3 20,4 15,4 20,1 18,0 18,1 15,2 16,1 16,8 23,8<br />
523,3 0,0 748,9 746,8 854,9 924,2 951,1 646,8 1099,6 1 073,8 954,5<br />
523,3 0,0 748,9 746,8 854,9 942,2 951,1 646,8 1099,6 1 073,8 954,5<br />
151,3 1 009,4 126,3 1 384,3 990,4 906,3 1 298,0 1 688,3 2 035,3 1 787,1 1 324,1<br />
Raspoloæivo za potroπnju /<br />
Available for consumption<br />
2 144,3 2 506,8 3 131,0 3 567,2 3 554,7 3 522,9 3 828,2 4 102,7 4 230,7 4 393,3 4 509,8<br />
Direktni potroπaËi / Direct consumers<br />
KAP / Aluminum Plant of Podgorica<br />
Æeljezara / Steelworks<br />
Æeljeznica / Railways<br />
Distribucija bruto / Gross distribution<br />
Neto potroπnja distribucije /<br />
Net energy consumption of distribution<br />
Gubici u distributivnoj mreæi /<br />
Losses in the distribution network<br />
Gubici u prijenosnoj mreæi /<br />
Losses in the transmission network<br />
505,4 763,0 1 233,9 1 629,9 1 580,6 1 511,0 1 711,3 1 885,4 1 998,6 2 024,7 2 104,7<br />
329,3 599,9 1 029,0 1 420,2 1 362,4 1 365,6 1 568,0 1 719,8 1 855,0 1 903,8 1 898,0<br />
154,1 139,3 174,5 180,4 186,8 130,4 123,8 144,5 122,5 99,9 184,4<br />
22,0 23,8 30,4 29,3 31,4 15,0 19,5 21,1 21,1 21,0 22,3<br />
1 531,0 1 641,7 1 747,9 1 794,9 1 847,2 1 863,2 1 967,0 2 062,6 2 077,0 2 196,7 2 212,1<br />
1 218,0 1 329,1 1 434,6 1 475,7 1 472,6 1 446,6 1 645,8 1 715,7 1 722,5 1 750,2 1 710,6<br />
313,0 312,6 313,3 319,2 374,6 416,6 321,2 346,9 354,5 446,5 501,5<br />
108,1 98,8 149,2 142,3 127,0 148,7 149,8 154,7 155,1 171,9 193,0<br />
U Crnoj Gori su tijekom 70-tih i 80-tih godina 20.<br />
stoljeÊa izgraappleeni znaËajni industrijski kapaciteti<br />
u energetski intenzivnim industrijskim granama<br />
(industrija obojenih metala, crna metalurgija).<br />
Meappleu takvim postrojenjima posebno se istiËu<br />
Kombinat aluminija Podgorica (KAP) i Æeljezara<br />
NikπiÊ. Samo pogoni KAP-a godiπnje potroπe oko<br />
45 % ukupne potroπnje elektriËne energije u Crnoj<br />
Gori. Osim u crnoj metalurgiji i industriji obojenih<br />
metala, relativno manji dio elektriËne energije se<br />
troπi u drvnoj, papirnoj, tekstilnoj, prehrambenoj i<br />
drugoj industriji. BuduÊi da je dinamika potroπnje<br />
elektriËne energije u industriji bitno drugaËija<br />
nego u sektorima kuÊanstva i usluga, od interesa je<br />
analizirati karakteristike potroπnje u toj kategoriji.<br />
In Montenegro, significant industrial facilities were<br />
constructed in energy intensive industrial branches<br />
(non-ferrous metals, ferrous metallurgy) during<br />
the 1970s and 1980s. Among such plants, the<br />
Aluminum Plant of Podgorica (KAP) and the NikπiÊ<br />
Steelworks stand out. The KAP plant alone uses<br />
approximately 45 % of the total energy consumed<br />
in Montenegro annually. Besides the ferrous<br />
metallurgy and the non-ferrous metal industries,<br />
a relatively small percentage of electrical energy<br />
is consumed in the wood, paper, textile, food<br />
and other industries. Since the dynamics of the<br />
consumption of electrical energy in industry<br />
is significantly different than in the sectors of<br />
households and services, it is of interest to analyze<br />
the characteristics of consumption in this category.<br />
Zeljko, M., »anoviÊ, M., Energetski sektor Crne Gore..., Energija, god. 56(2007), br. 3., str. 292∑327<br />
Zeljko, M., »anoviÊ, M., The Current Situation and Future..., Energija, vol. 56(2007), No. 3, pp. 292∑327<br />
302