Gaming the Float: How Managers Respond to EPS-based Incentives
Gaming the Float: How Managers Respond to EPS-based Incentives
Gaming the Float: How Managers Respond to EPS-based Incentives

You also want an ePaper? Increase the reach of your titles
YUMPU automatically turns print PDFs into web optimized ePapers that Google loves.
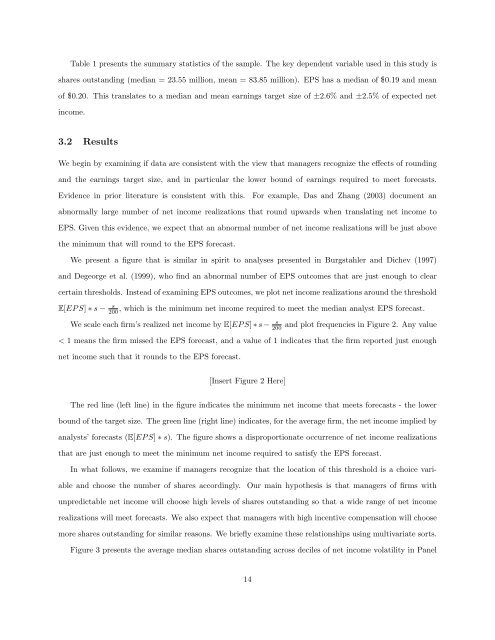
Table 1 presents <strong>the</strong> summary statistics of <strong>the</strong> sample. The key dependent variable used in this study is<br />
shares outstanding (median = 23.55 million, mean = 83.85 million). <strong>EPS</strong> has a median of $0.19 and mean<br />
of $0.20. This translates <strong>to</strong> a median and mean earnings target size of ±2.6% and ±2.5% of expected net<br />
income.<br />
3.2 Results<br />
We begin by examining if data are consistent with <strong>the</strong> view that managers recognize <strong>the</strong> effects of rounding<br />
and <strong>the</strong> earnings target size, and in particular <strong>the</strong> lower bound of earnings required <strong>to</strong> meet forecasts.<br />
Evidence in prior literature is consistent with this.<br />
For example, Das and Zhang (2003) document an<br />
abnormally large number of net income realizations that round upwards when translating net income <strong>to</strong><br />
<strong>EPS</strong>. Given this evidence, we expect that an abnormal number of net income realizations will be just above<br />
<strong>the</strong> minimum that will round <strong>to</strong> <strong>the</strong> <strong>EPS</strong> forecast.<br />
We present a figure that is similar in spirit <strong>to</strong> analyses presented in Burgstahler and Dichev (1997)<br />
and Degeorge et al. (1999), who find an abnormal number of <strong>EPS</strong> outcomes that are just enough <strong>to</strong> clear<br />
certain thresholds. Instead of examining <strong>EPS</strong> outcomes, we plot net income realizations around <strong>the</strong> threshold<br />
E[EP S] ∗ s −<br />
s<br />
200<br />
, which is <strong>the</strong> minimum net income required <strong>to</strong> meet <strong>the</strong> median analyst <strong>EPS</strong> forecast.<br />
We scale each firm’s realized net income by E[EP S] ∗ s − s<br />
200<br />
and plot frequencies in Figure 2. Any value<br />
< 1 means <strong>the</strong> firm missed <strong>the</strong> <strong>EPS</strong> forecast, and a value of 1 indicates that <strong>the</strong> firm reported just enough<br />
net income such that it rounds <strong>to</strong> <strong>the</strong> <strong>EPS</strong> forecast.<br />
[Insert Figure 2 Here]<br />
The red line (left line) in <strong>the</strong> figure indicates <strong>the</strong> minimum net income that meets forecasts - <strong>the</strong> lower<br />
bound of <strong>the</strong> target size. The green line (right line) indicates, for <strong>the</strong> average firm, <strong>the</strong> net income implied by<br />
analysts’ forecasts (E[EP S] ∗ s). The figure shows a disproportionate occurrence of net income realizations<br />
that are just enough <strong>to</strong> meet <strong>the</strong> minimum net income required <strong>to</strong> satisfy <strong>the</strong> <strong>EPS</strong> forecast.<br />
In what follows, we examine if managers recognize that <strong>the</strong> location of this threshold is a choice variable<br />
and choose <strong>the</strong> number of shares accordingly.<br />
Our main hypo<strong>the</strong>sis is that managers of firms with<br />
unpredictable net income will choose high levels of shares outstanding so that a wide range of net income<br />
realizations will meet forecasts. We also expect that managers with high incentive compensation will choose<br />
more shares outstanding for similar reasons. We briefly examine <strong>the</strong>se relationships using multivariate sorts.<br />
Figure 3 presents <strong>the</strong> average median shares outstanding across deciles of net income volatility in Panel<br />
14