Gaming the Float: How Managers Respond to EPS-based Incentives
Gaming the Float: How Managers Respond to EPS-based Incentives
Gaming the Float: How Managers Respond to EPS-based Incentives

Create successful ePaper yourself
Turn your PDF publications into a flip-book with our unique Google optimized e-Paper software.
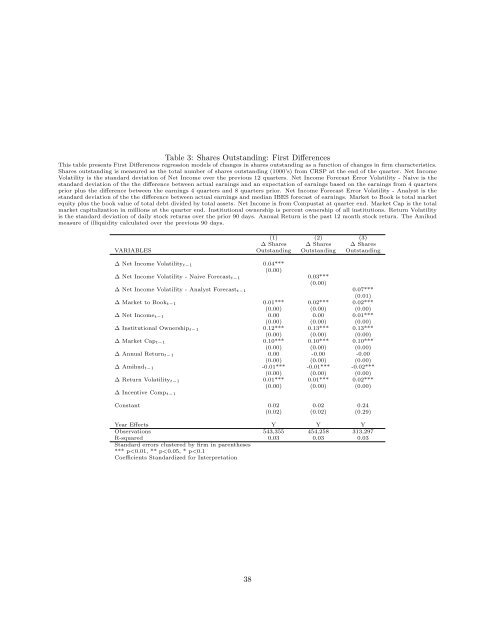
Table 3: Shares Outstanding: First Differences<br />
This table presents First Differences regression models of changes in shares outstanding as a function of changes in firm characteristics.<br />
Shares outstanding is measured as <strong>the</strong> <strong>to</strong>tal number of shares outstanding (1000’s) from CRSP at <strong>the</strong> end of <strong>the</strong> quarter. Net Income<br />
Volatility is <strong>the</strong> standard deviation of Net Income over <strong>the</strong> previous 12 quarters. Net Income Forecast Error Volatility - Naive is <strong>the</strong><br />
standard deviation of <strong>the</strong> <strong>the</strong> difference between actual earnings and an expectation of earnings <strong>based</strong> on <strong>the</strong> earnings from 4 quarters<br />
prior plus <strong>the</strong> difference between <strong>the</strong> earnings 4 quarters and 8 quarters prior. Net Income Forecast Error Volatility - Analyst is <strong>the</strong><br />
standard deviation of <strong>the</strong> <strong>the</strong> difference between actual earnings and median IBES forecast of earnings. Market <strong>to</strong> Book is <strong>to</strong>tal market<br />
equity plus <strong>the</strong> book value of <strong>to</strong>tal debt divided by <strong>to</strong>tal assets. Net Income is from Compustat at quarter end. Market Cap is <strong>the</strong> <strong>to</strong>tal<br />
market capitalization in millions at <strong>the</strong> quarter end. Institutional ownership is percent ownership of all institutions. Return Volatility<br />
is <strong>the</strong> standard deviation of daily s<strong>to</strong>ck returns over <strong>the</strong> prior 90 days. Annual Return is <strong>the</strong> past 12 month s<strong>to</strong>ck return. The Amihud<br />
measure of illiquidity calculated over <strong>the</strong> previous 90 days.<br />
(1) (2) (3)<br />
∆ Shares ∆ Shares ∆ Shares<br />
VARIABLES Outstanding Outstanding Outstanding<br />
∆ Net Income Volatility t−1 0.04***<br />
(0.00)<br />
∆ Net Income Volatility - Naive Forecast t−1 0.03***<br />
(0.00)<br />
∆ Net Income Volatility - Analyst Forecast t−1 0.07***<br />
(0.01)<br />
∆ Market <strong>to</strong> Book t−1 0.01*** 0.02*** 0.02***<br />
(0.00) (0.00) (0.00)<br />
∆ Net Income t−1 0.00 0.00 0.01***<br />
(0.00) (0.00) (0.00)<br />
∆ Institutional Ownership t−1 0.12*** 0.13*** 0.13***<br />
(0.00) (0.00) (0.00)<br />
∆ Market Cap t−1 0.10*** 0.10*** 0.10***<br />
(0.00) (0.00) (0.00)<br />
∆ Annual Return t−1 0.00 -0.00 -0.00<br />
(0.00) (0.00) (0.00)<br />
∆ Amihud t−1 -0.01*** -0.01*** -0.02***<br />
(0.00) (0.00) (0.00)<br />
∆ Return Volatility t−1 0.01*** 0.01*** 0.02***<br />
(0.00) (0.00) (0.00)<br />
∆ Incentive Comp t−1<br />
Constant 0.02 0.02 0.24<br />
(0.02) (0.02) (0.29)<br />
Year Effects Y Y Y<br />
Observations 543,355 454,258 313,297<br />
R-squared 0.03 0.03 0.03<br />
Standard errors clustered by firm in paren<strong>the</strong>ses<br />
*** p