Gaming the Float: How Managers Respond to EPS-based Incentives
Gaming the Float: How Managers Respond to EPS-based Incentives
Gaming the Float: How Managers Respond to EPS-based Incentives

Create successful ePaper yourself
Turn your PDF publications into a flip-book with our unique Google optimized e-Paper software.
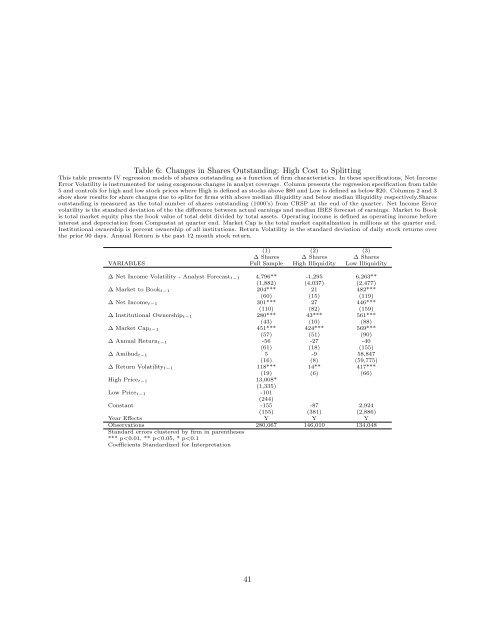
Table 6: Changes in Shares Outstanding: High Cost <strong>to</strong> Splitting<br />
This table presents IV regression models of shares outstanding as a function of firm characteristics. In <strong>the</strong>se specifications, Net Income<br />
Error Volatility is instrumented for using exogenous changes in analyst coverage. Column presents <strong>the</strong> regression specification from table<br />
5 and controls for high and low s<strong>to</strong>ck prices where High is defined as s<strong>to</strong>cks above $80 and Low is defined as below $20. Columns 2 and 3<br />
show show results for share changes due <strong>to</strong> splits for firms with above median illiquidity and below median illiquidity respectively.Shares<br />
outstanding is measured as <strong>the</strong> <strong>to</strong>tal number of shares outstanding (1000’s) from CRSP at <strong>the</strong> end of <strong>the</strong> quarter. Net Income Error<br />
volatility is <strong>the</strong> standard deviation of <strong>the</strong> <strong>the</strong> difference between actual earnings and median IBES forecast of earnings. Market <strong>to</strong> Book<br />
is <strong>to</strong>tal market equity plus <strong>the</strong> book value of <strong>to</strong>tal debt divided by <strong>to</strong>tal assets. Operating income is defined as operating income before<br />
interest and depreciation from Compustat at quarter end. Market Cap is <strong>the</strong> <strong>to</strong>tal market capitalization in millions at <strong>the</strong> quarter end.<br />
Institutional ownership is percent ownership of all institutions. Return Volatility is <strong>the</strong> standard deviation of daily s<strong>to</strong>ck returns over<br />
<strong>the</strong> prior 90 days. Annual Return is <strong>the</strong> past 12 month s<strong>to</strong>ck return.<br />
(1) (2) (3)<br />
∆ Shares ∆ Shares ∆ Shares<br />
VARIABLES Full Sample High Illiquidity Low Illiquidity<br />
∆ Net Income Volatility - Analyst Forecast t−1 4,796** -1,295 6,263**<br />
(1,882) (4,037) (2,477)<br />
∆ Market <strong>to</strong> Book t−1 204*** 21 482***<br />
(60) (15) (119)<br />
∆ Net Income t−1 301*** 27 446***<br />
(110) (82) (159)<br />
∆ Institutional Ownership t−1 280*** 43*** 561***<br />
(43) (10) (88)<br />
∆ Market Cap t−1 451*** 424*** 569***<br />
(57) (51) (90)<br />
∆ Annual Return t−1 -56 -27 -40<br />
(61) (18) (155)<br />
∆ Amihud t−1 5 -9 58,847<br />
(16) (8) (59,775)<br />
∆ Return Volatility t−1 118*** 14** 417***<br />
(19) (6) (66)<br />
High Price t−1 13,008*<br />
(1,335)<br />
Low Price t−1 -101<br />
(244)<br />
Constant -155 -87 2,924<br />
(155) (381) (2,886)<br />
Year Effects Y Y Y<br />
Observations 280,067 146,010 134,048<br />
Standard errors clustered by firm in paren<strong>the</strong>ses<br />
*** p