Gaming the Float: How Managers Respond to EPS-based Incentives
Gaming the Float: How Managers Respond to EPS-based Incentives
Gaming the Float: How Managers Respond to EPS-based Incentives
You also want an ePaper? Increase the reach of your titles
YUMPU automatically turns print PDFs into web optimized ePapers that Google loves.
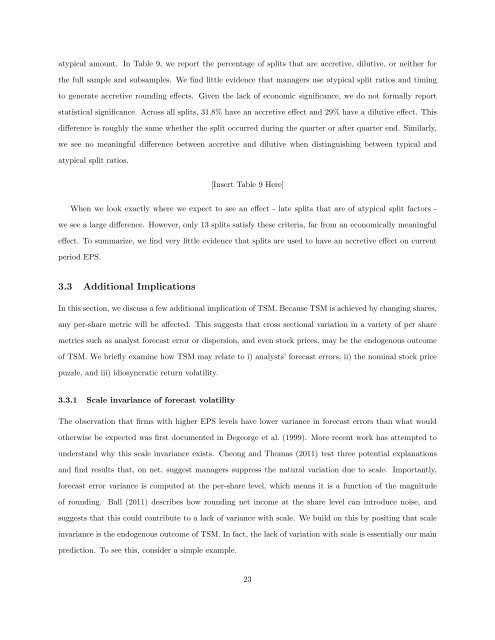
atypical amount. In Table 9, we report <strong>the</strong> percentage of splits that are accretive, dilutive, or nei<strong>the</strong>r for<br />
<strong>the</strong> full sample and subsamples. We find little evidence that managers use atypical split ratios and timing<br />
<strong>to</strong> generate accretive rounding effects. Given <strong>the</strong> lack of economic significance, we do not formally report<br />
statistical significance. Across all splits, 31.8% have an accretive effect and 29% have a dilutive effect. This<br />
difference is roughly <strong>the</strong> same whe<strong>the</strong>r <strong>the</strong> split occurred during <strong>the</strong> quarter or after quarter end. Similarly,<br />
we see no meaningful difference between accretive and dilutive when distinguishing between typical and<br />
atypical split ratios.<br />
[Insert Table 9 Here]<br />
When we look exactly where we expect <strong>to</strong> see an effect - late splits that are of atypical split fac<strong>to</strong>rs -<br />
we see a large difference. <strong>How</strong>ever, only 13 splits satisfy <strong>the</strong>se criteria, far from an economically meaningful<br />
effect. To summarize, we find very little evidence that splits are used <strong>to</strong> have an accretive effect on current<br />
period <strong>EPS</strong>.<br />
3.3 Additional Implications<br />
In this section, we discuss a few additional implication of TSM. Because TSM is achieved by changing shares,<br />
any per-share metric will be affected. This suggests that cross sectional variation in a variety of per share<br />
metrics such as analyst forecast error or dispersion, and even s<strong>to</strong>ck prices, may be <strong>the</strong> endogenous outcome<br />
of TSM. We briefly examine how TSM may relate <strong>to</strong> i) analysts’ forecast errors, ii) <strong>the</strong> nominal s<strong>to</strong>ck price<br />
puzzle, and iii) idiosyncratic return volatility.<br />
3.3.1 Scale invariance of forecast volatility<br />
The observation that firms with higher <strong>EPS</strong> levels have lower variance in forecast errors than what would<br />
o<strong>the</strong>rwise be expected was first documented in Degeorge et al. (1999). More recent work has attempted <strong>to</strong><br />
understand why this scale invariance exists. Cheong and Thomas (2011) test three potential explanations<br />
and find results that, on net, suggest managers suppress <strong>the</strong> natural variation due <strong>to</strong> scale. Importantly,<br />
forecast error variance is computed at <strong>the</strong> per-share level, which means it is a function of <strong>the</strong> magnitude<br />
of rounding. Ball (2011) describes how rounding net income at <strong>the</strong> share level can introduce noise, and<br />
suggests that this could contribute <strong>to</strong> a lack of variance with scale. We build on this by positing that scale<br />
invariance is <strong>the</strong> endogenous outcome of TSM. In fact, <strong>the</strong> lack of variation with scale is essentially our main<br />
prediction. To see this, consider a simple example.<br />
23


