Gaming the Float: How Managers Respond to EPS-based Incentives
Gaming the Float: How Managers Respond to EPS-based Incentives
Gaming the Float: How Managers Respond to EPS-based Incentives

You also want an ePaper? Increase the reach of your titles
YUMPU automatically turns print PDFs into web optimized ePapers that Google loves.
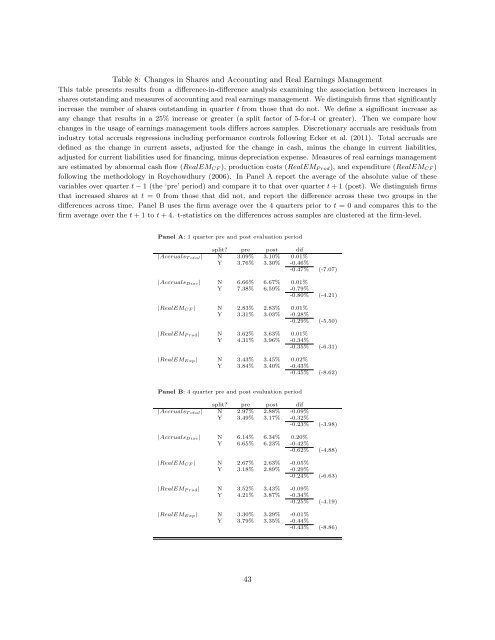
Table 8: Changes in Shares and Accounting and Real Earnings Management<br />
This table presents results from a difference-in-difference analysis examining <strong>the</strong> association between increases in<br />
shares outstanding and measures of accounting and real earnings management. We distinguish firms that significantly<br />
increase <strong>the</strong> number of shares outstanding in quarter t from those that do not. We define a significant increase as<br />
any change that results in a 25% increase or greater (a split fac<strong>to</strong>r of 5-for-4 or greater). Then we compare how<br />
changes in <strong>the</strong> usage of earnings management <strong>to</strong>ols differs across samples. Discretionary accruals are residuals from<br />
industry <strong>to</strong>tal accruals regressions including performance controls following Ecker et al. (2011). Total accruals are<br />
defined as <strong>the</strong> change in current assets, adjusted for <strong>the</strong> change in cash, minus <strong>the</strong> change in current liabilities,<br />
adjusted for current liabilities used for financing, minus depreciation expense. Measures of real earnings management<br />
are estimated by abnormal cash flow (RealEM CF ), production costs (RealEM P rod ), and expenditure (RealEM CF )<br />
following <strong>the</strong> methodology in Roychowdhury (2006). In Panel A report <strong>the</strong> average of <strong>the</strong> absolute value of <strong>the</strong>se<br />
variables over quarter t − 1 (<strong>the</strong> ‘pre’ period) and compare it <strong>to</strong> that over quarter t + 1 (post). We distinguish firms<br />
that increased shares at t = 0 from those that did not, and report <strong>the</strong> difference across <strong>the</strong>se two groups in <strong>the</strong><br />
differences across time. Panel B uses <strong>the</strong> firm average over <strong>the</strong> 4 quarters prior <strong>to</strong> t = 0 and compares this <strong>to</strong> <strong>the</strong><br />
firm average over <strong>the</strong> t + 1 <strong>to</strong> t + 4. t-statistics on <strong>the</strong> differences across samples are clustered at <strong>the</strong> firm-level.<br />
Panel A: 1 quarter pre and post evaluation period<br />
split? pre post dif<br />
|Accruals T otal | N 3.09% 3.10% 0.01%<br />
Y 3.76% 3.30% -0.46%<br />
-0.47% (-7.07)<br />
|Accruals Disc | N 6.66% 6.67% 0.01%<br />
Y 7.38% 6.59% -0.79%<br />
-0.80% (-4.21)<br />
|RealEM CF | N 2.83% 2.83% 0.01%<br />
Y 3.31% 3.03% -0.28%<br />
-0.29% (-5.50)<br />
|RealEM P rod | N 3.62% 3.63% 0.01%<br />
Y 4.31% 3.96% -0.34%<br />
-0.35% (-6.31)<br />
|RealEM Exp | N 3.43% 3.45% 0.02%<br />
Y 3.84% 3.40% -0.43%<br />
-0.45% (-8.62)<br />
Panel B: 4 quarter pre and post evaluation period<br />
split? pre post dif<br />
|Accruals T otal | N 2.97% 2.88% -0.09%<br />
Y 3.49% 3.17% -0.32%<br />
-0.23% (-3.98)<br />
|Accruals Disc | N 6.14% 6.34% 0.20%<br />
Y 6.65% 6.23% -0.42%<br />
-0.62% (-4.88)<br />
|RealEM CF | N 2.67% 2.63% -0.05%<br />
Y 3.18% 2.89% -0.29%<br />
-0.24% (-6.63)<br />
|RealEM P rod | N 3.52% 3.43% -0.09%<br />
Y 4.21% 3.87% -0.34%<br />
-0.25% (-4.19)<br />
|RealEM Exp | N 3.30% 3.29% -0.01%<br />
Y 3.79% 3.35% -0.44%<br />
-0.43% (-8.86)<br />
43