Gaming the Float: How Managers Respond to EPS-based Incentives
Gaming the Float: How Managers Respond to EPS-based Incentives
Gaming the Float: How Managers Respond to EPS-based Incentives
Create successful ePaper yourself
Turn your PDF publications into a flip-book with our unique Google optimized e-Paper software.
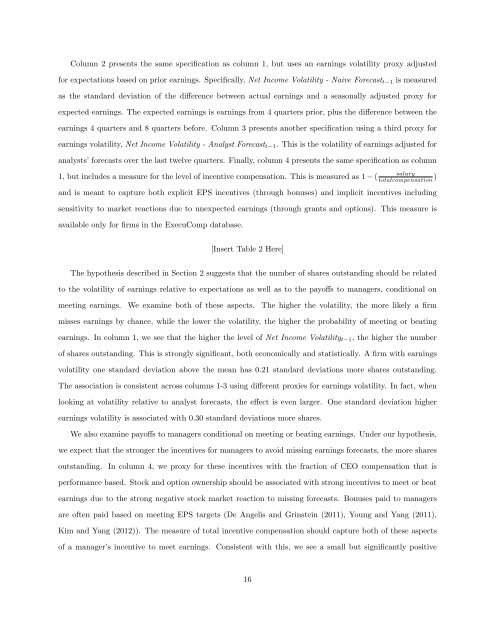
Column 2 presents <strong>the</strong> same specification as column 1, but uses an earnings volatility proxy adjusted<br />
for expectations <strong>based</strong> on prior earnings. Specifically, Net Income Volatility - Naive Forecast t−1 is measured<br />
as <strong>the</strong> standard deviation of <strong>the</strong> difference between actual earnings and a seasonally adjusted proxy for<br />
expected earnings. The expected earnings is earnings from 4 quarters prior, plus <strong>the</strong> difference between <strong>the</strong><br />
earnings 4 quarters and 8 quarters before. Column 3 presents ano<strong>the</strong>r specification using a third proxy for<br />
earnings volatility, Net Income Volatility - Analyst Forecast t−1 . This is <strong>the</strong> volatility of earnings adjusted for<br />
analysts’ forecasts over <strong>the</strong> last twelve quarters. Finally, column 4 presents <strong>the</strong> same specification as column<br />
1, but includes a measure for <strong>the</strong> level of incentive compensation. This is measured as 1 − (<br />
salary<br />
<strong>to</strong>talcompensation )<br />
and is meant <strong>to</strong> capture both explicit <strong>EPS</strong> incentives (through bonuses) and implicit incentives including<br />
sensitivity <strong>to</strong> market reactions due <strong>to</strong> unexpected earnings (through grants and options). This measure is<br />
available only for firms in <strong>the</strong> ExecuComp database.<br />
[Insert Table 2 Here]<br />
The hypo<strong>the</strong>sis described in Section 2 suggests that <strong>the</strong> number of shares outstanding should be related<br />
<strong>to</strong> <strong>the</strong> volatility of earnings relative <strong>to</strong> expectations as well as <strong>to</strong> <strong>the</strong> payoffs <strong>to</strong> managers, conditional on<br />
meeting earnings. We examine both of <strong>the</strong>se aspects. The higher <strong>the</strong> volatility, <strong>the</strong> more likely a firm<br />
misses earnings by chance, while <strong>the</strong> lower <strong>the</strong> volatility, <strong>the</strong> higher <strong>the</strong> probability of meeting or beating<br />
earnings. In column 1, we see that <strong>the</strong> higher <strong>the</strong> level of Net Income Volatility t−1 , <strong>the</strong> higher <strong>the</strong> number<br />
of shares outstanding. This is strongly significant, both economically and statistically. A firm with earnings<br />
volatility one standard deviation above <strong>the</strong> mean has 0.21 standard deviations more shares outstanding.<br />
The association is consistent across columns 1-3 using different proxies for earnings volatility. In fact, when<br />
looking at volatility relative <strong>to</strong> analyst forecasts, <strong>the</strong> effect is even larger. One standard deviation higher<br />
earnings volatility is associated with 0.30 standard deviations more shares.<br />
We also examine payoffs <strong>to</strong> managers conditional on meeting or beating earnings. Under our hypo<strong>the</strong>sis,<br />
we expect that <strong>the</strong> stronger <strong>the</strong> incentives for managers <strong>to</strong> avoid missing earnings forecasts, <strong>the</strong> more shares<br />
outstanding. In column 4, we proxy for <strong>the</strong>se incentives with <strong>the</strong> fraction of CEO compensation that is<br />
performance <strong>based</strong>. S<strong>to</strong>ck and option ownership should be associated with strong incentives <strong>to</strong> meet or beat<br />
earnings due <strong>to</strong> <strong>the</strong> strong negative s<strong>to</strong>ck market reaction <strong>to</strong> missing forecasts. Bonuses paid <strong>to</strong> managers<br />
are often paid <strong>based</strong> on meeting <strong>EPS</strong> targets (De Angelis and Grinstein (2011), Young and Yang (2011),<br />
Kim and Yang (2012)). The measure of <strong>to</strong>tal incentive compensation should capture both of <strong>the</strong>se aspects<br />
of a manager’s incentive <strong>to</strong> meet earnings. Consistent with this, we see a small but significantly positive<br />
16


