Gaming the Float: How Managers Respond to EPS-based Incentives
Gaming the Float: How Managers Respond to EPS-based Incentives
Gaming the Float: How Managers Respond to EPS-based Incentives

Create successful ePaper yourself
Turn your PDF publications into a flip-book with our unique Google optimized e-Paper software.
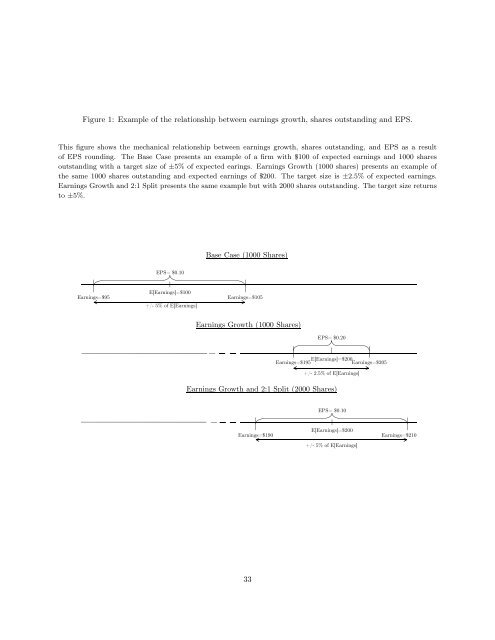
Figure 1: Example of <strong>the</strong> relationship between earnings growth, shares outstanding and <strong>EPS</strong>.<br />
This figure shows <strong>the</strong> mechanical relationship between earnings growth, shares outstanding, and <strong>EPS</strong> as a result<br />
of <strong>EPS</strong> rounding. The Base Case presents an example of a firm with $100 of expected earnings and 1000 shares<br />
outstanding with a target size of ±5% of expected earings. Earnings Growth (1000 shares) presents an example of<br />
<strong>the</strong> same 1000 shares outstanding and expected earnings of $200. The target size is ±2.5% of expected earnings.<br />
Earnings Growth and 2:1 Split presents <strong>the</strong> same example but with 2000 shares outstanding. The target size returns<br />
<strong>to</strong> ±5%.<br />
Base Case (1000 Shares)<br />
<strong>EPS</strong>= $0.10<br />
Earnings=$95<br />
E[Earnings]=$100<br />
+/- 5% of E[Earnings]<br />
Earnings=$105<br />
Earnings Growth (1000 Shares)<br />
<strong>EPS</strong>= $0.20<br />
E[Earnings]=$200<br />
Earnings=$195<br />
Earnings=$205<br />
+/- 2.5% of E[Earnings]<br />
Earnings Growth and 2:1 Split (2000 Shares)<br />
<strong>EPS</strong>= $0.10<br />
Earnings=$190<br />
E[Earnings]=$200<br />
+/- 5% of E[Earnings]<br />
Earnings=$210<br />
33